Peter G’s Data Visualisation
Data Visualisation
Maps/GIS
Biostatistics and Data Science
Categories
All
(49)
2025
(37)
2026
(12)
Alex Mann
(1)
dashboard
(1)
Dashboards
(1)
Data Visualization
(49)
Machine Learning
(1)
Numpy
(2)
Pandas
(1)
plotly
(1)
Polars
(1)
python
(1)
Python
(6)
Python Programming
(12)
R Programming
(32)
Rugby
(2)
shiny
(1)
shinyapp
(1)
streamlit
(1)
TidyTuesday
(47)
Data Viz
ggplot
Data Visualisation
R
Python
quarto
A webpage showcasing my data visualisation projects
Modified
May 4, 2026
Order By
Default
Title
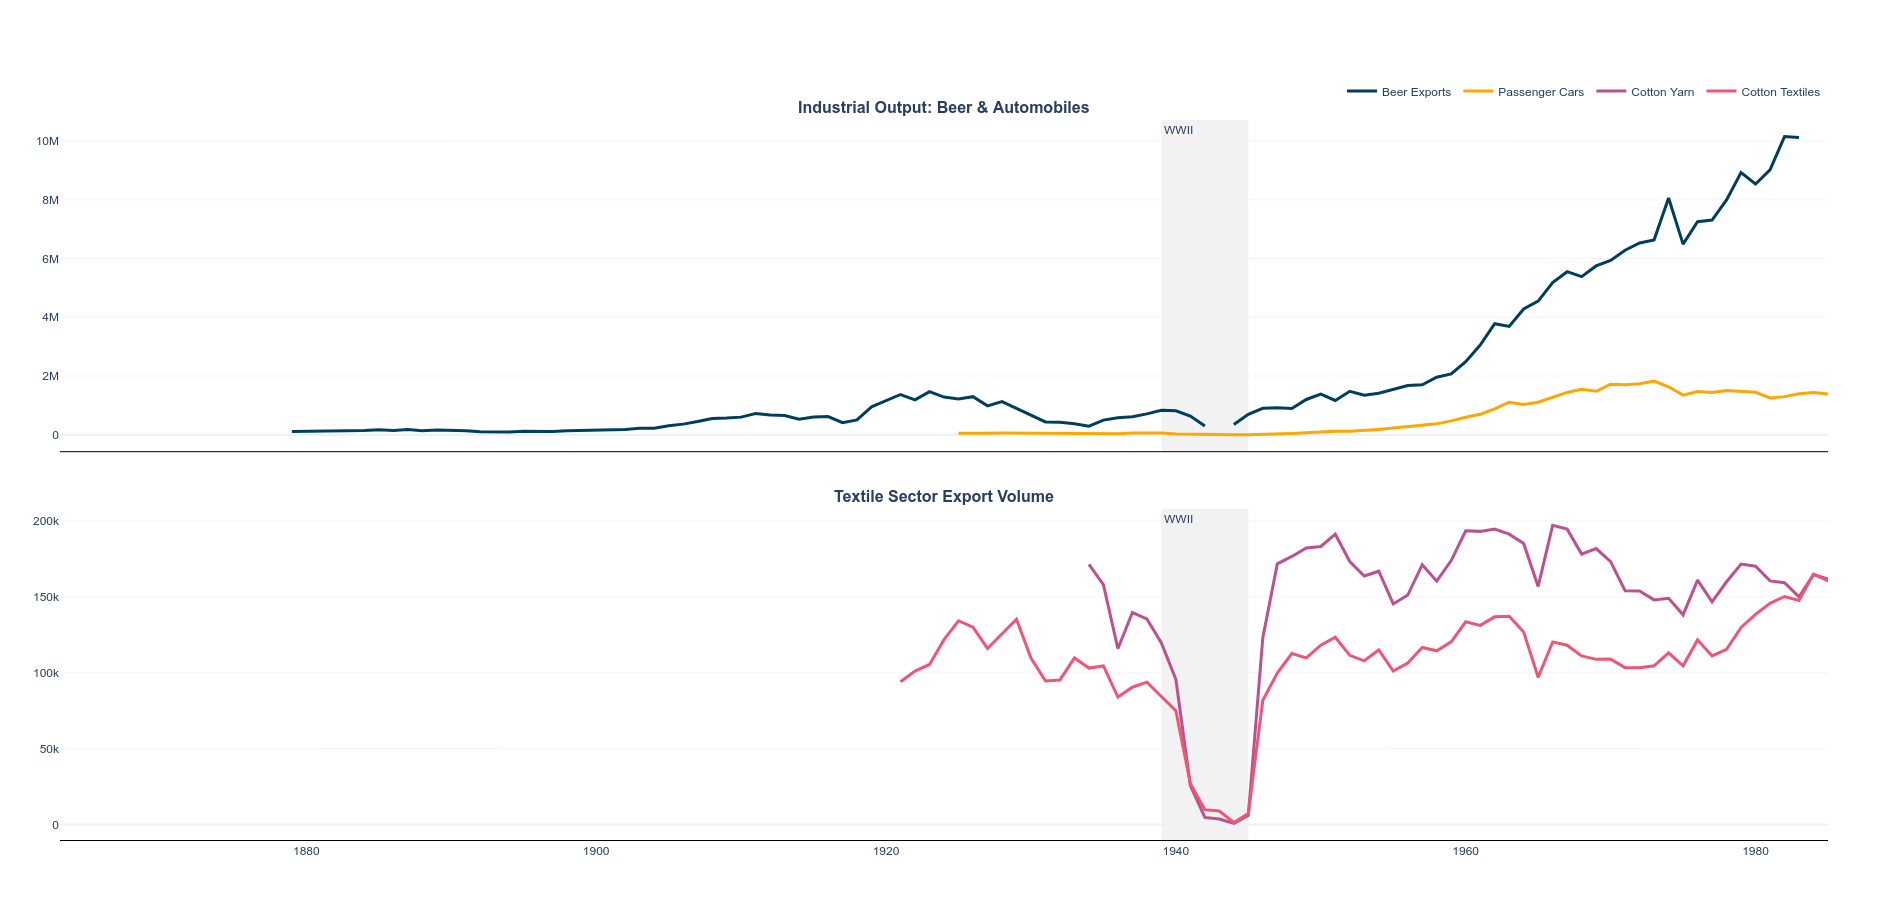
TidyTuesday (2026) Week 18: Italy Exports
5 May, 2026
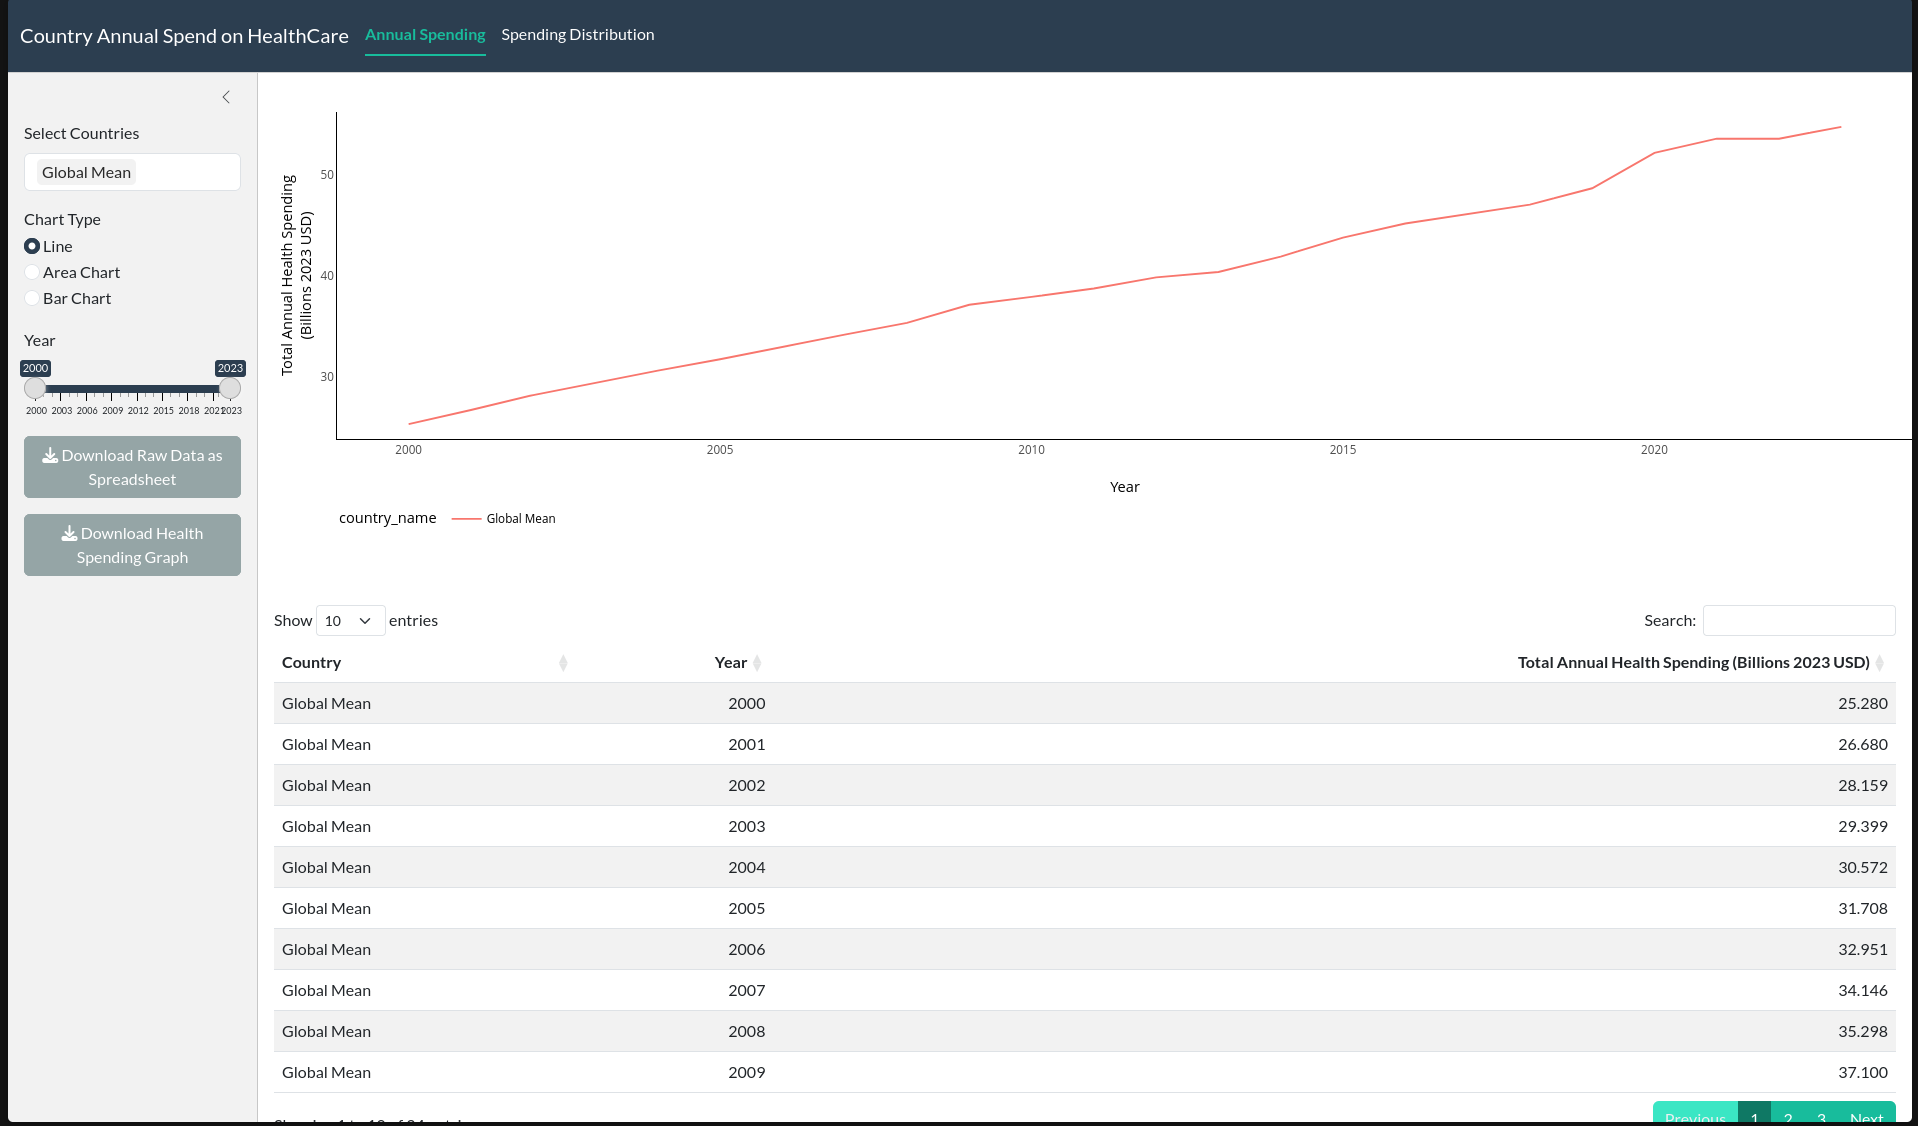
TidyTuesday (2026) Week 16: Global Health Spending
20 Apr, 2026
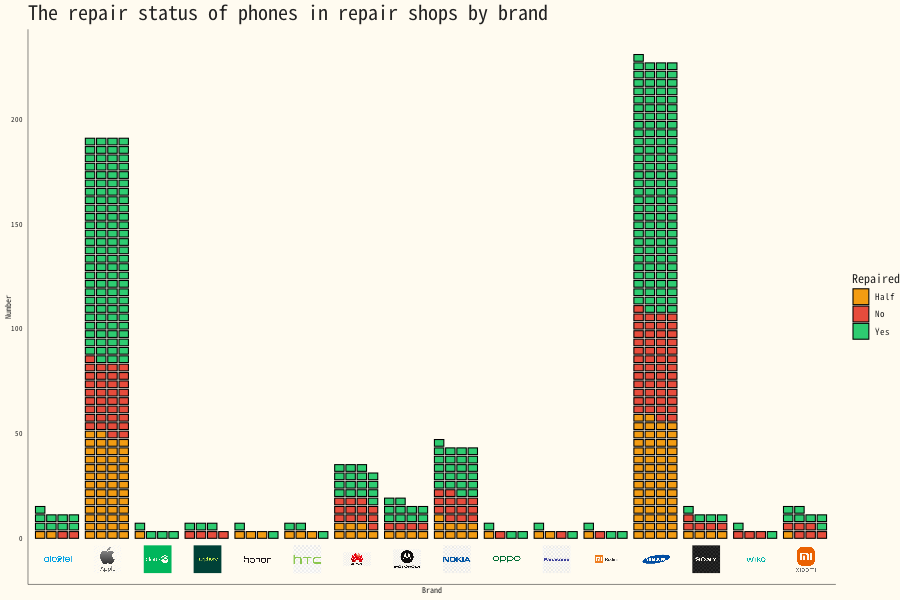
TidyTuesday (2026) Week 14: Repair Cafes Worldwide
7 Apr, 2026
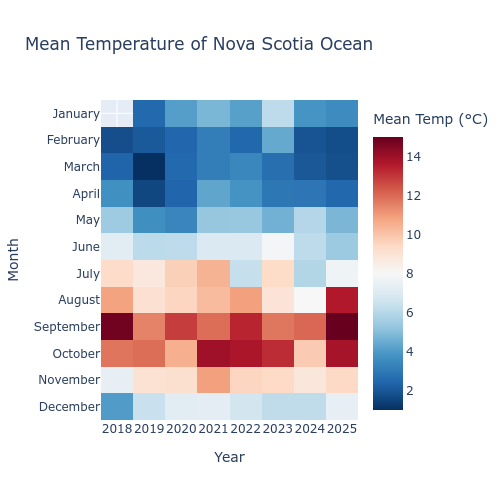
TidyTuesday (2026) Week 13: Coastal Ocean Temperature by Depth
1 Apr, 2026
TidyTuesday (2026) Week 11: One Million Digits of Pi?
25 Mar, 2026
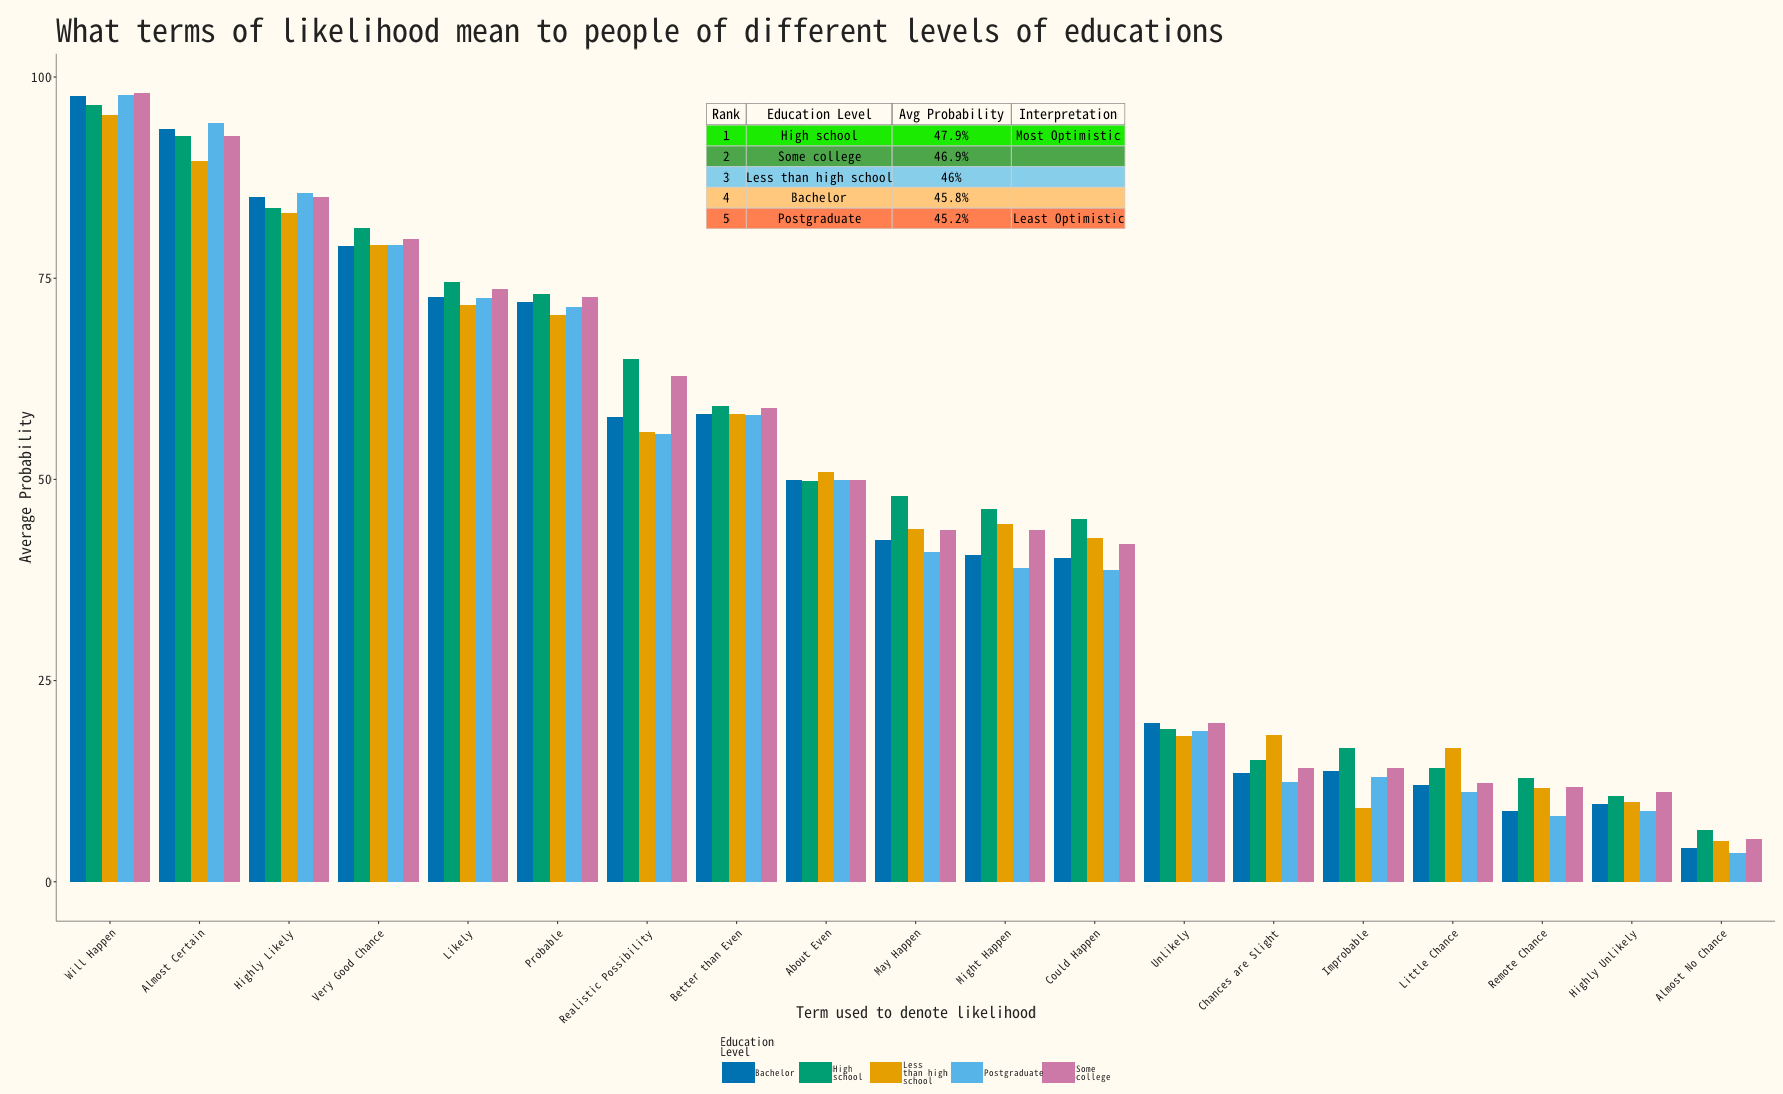
TidyTuesday (2026) Week 10: How likely is ‘likely’?
10 Mar, 2026
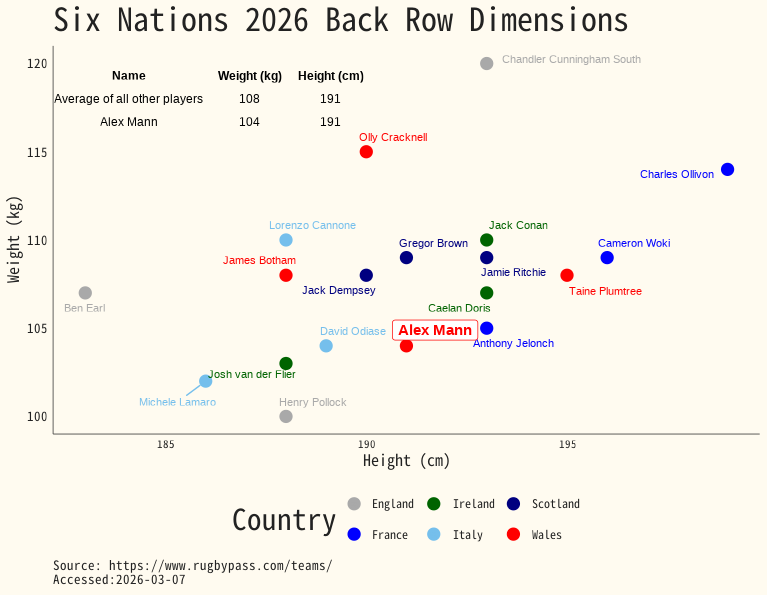
A comaprison of Back Row Heights and Weights in the 2026 Six Nations
7 Mar, 2026
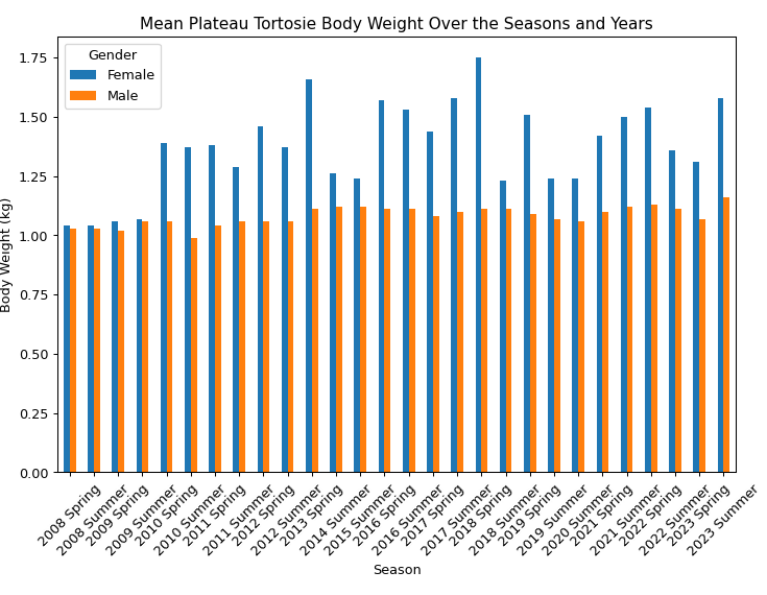
TidyTuesday (2026) Week 9: Golem Grad Tortoise Data
24 Feb, 2026
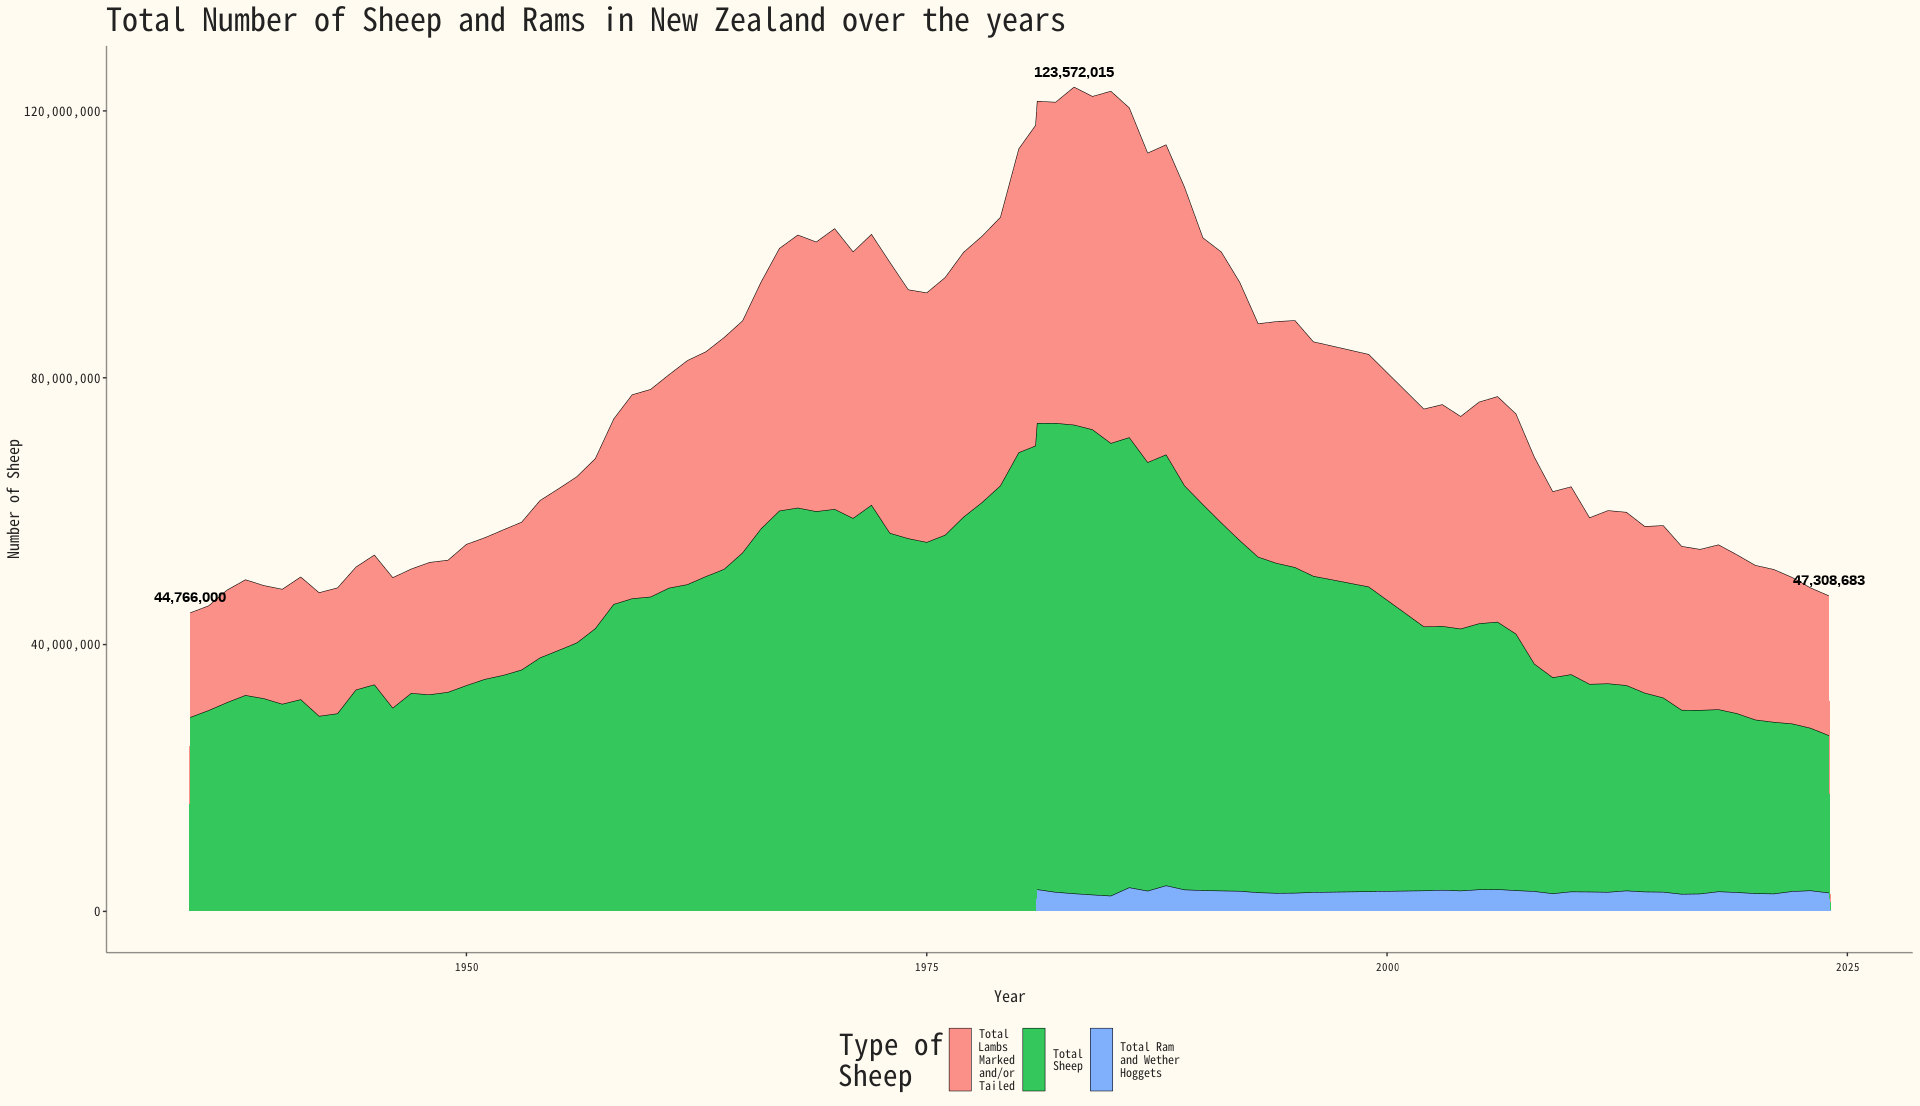
TidyTuesday (2026) Week 7: Agricultural Production Statistics in New Zealand
17 Feb, 2026
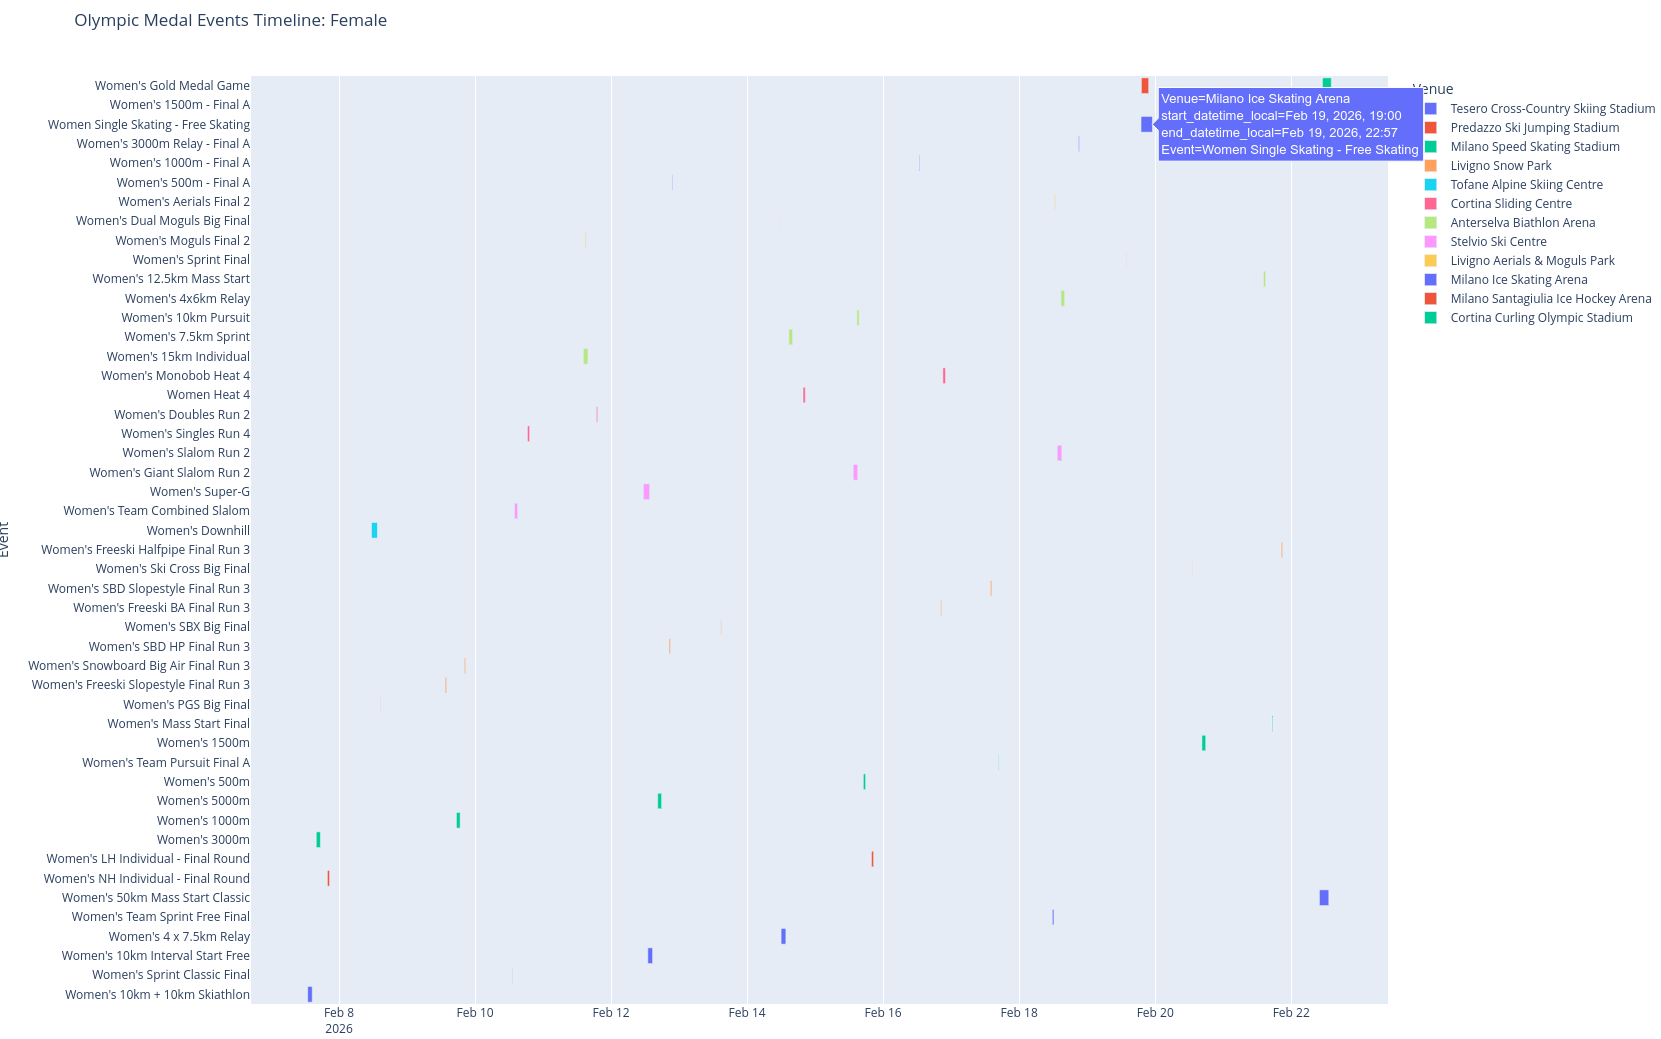
TidyTuesday (2026) Week 6: Winter Olympics 2026
10 Feb, 2026
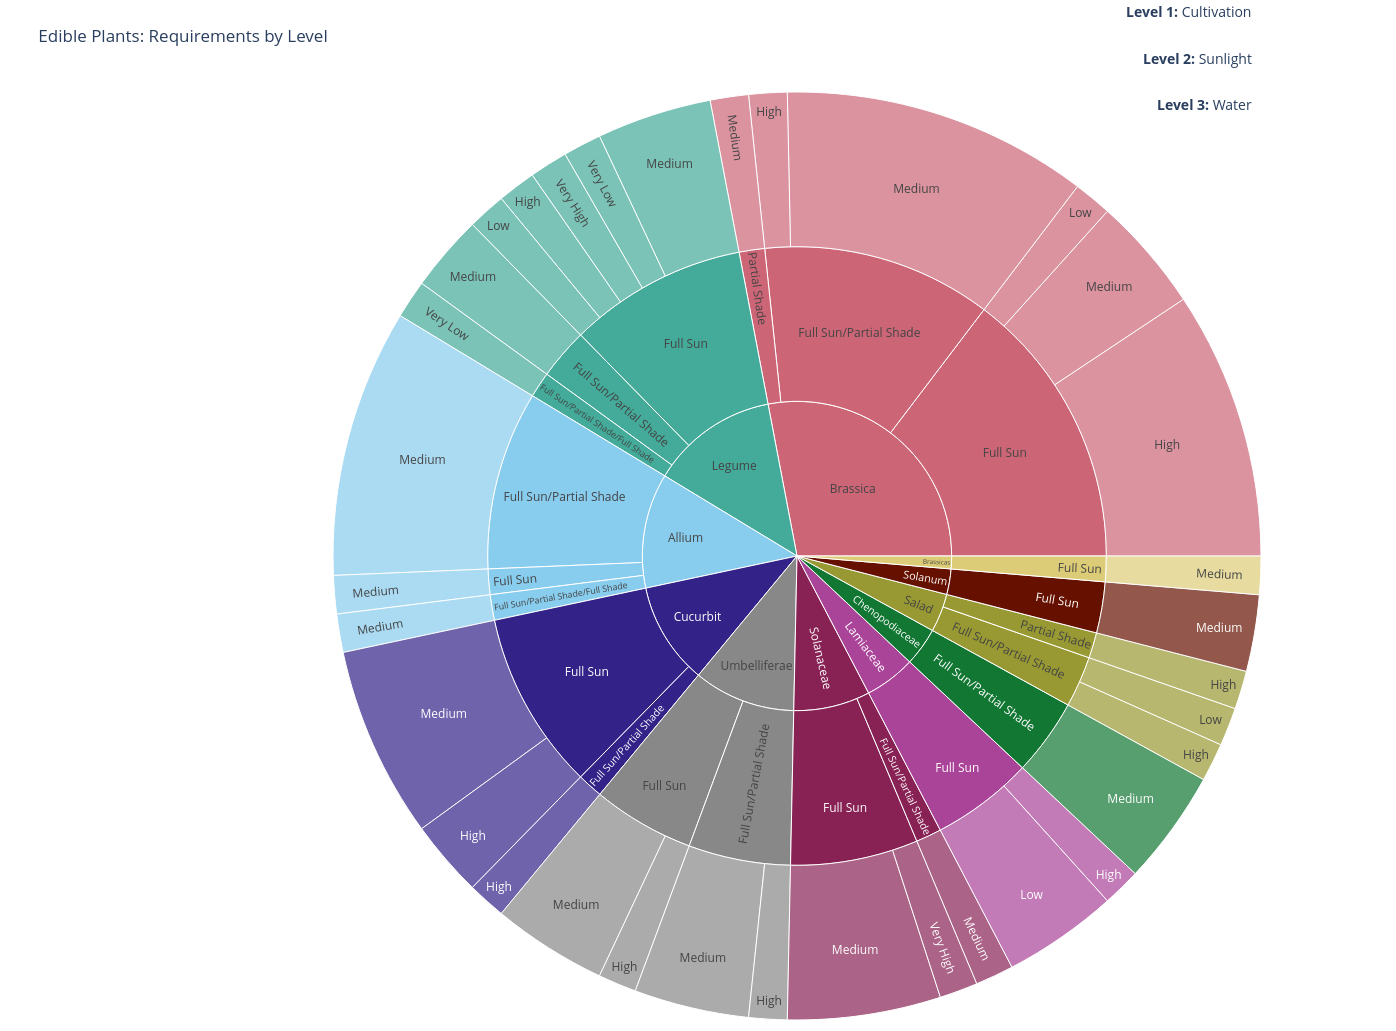
TidyTuesday (2026) Week 5: Edible Plants
2 Feb, 2026
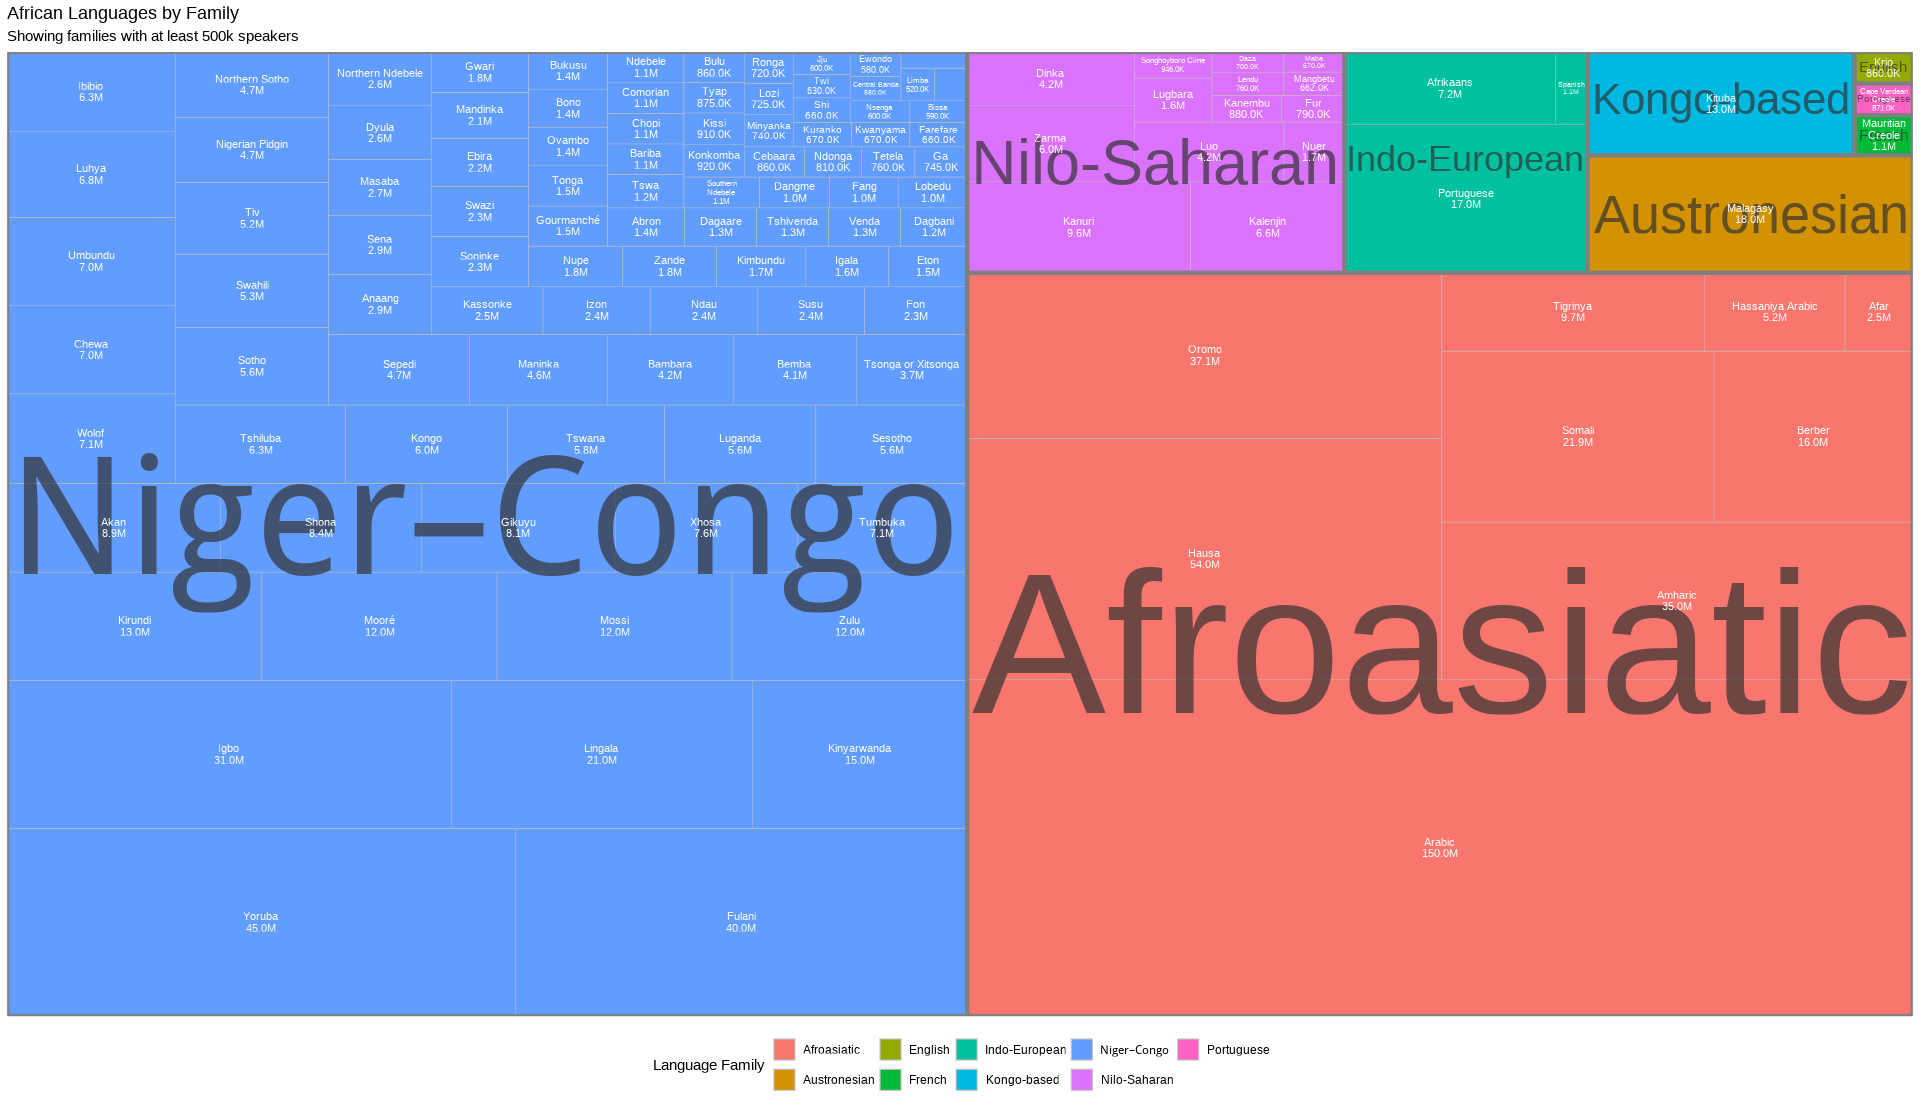
TidyTuesday (2026) Week 1: African Languages
12 Jan, 2026
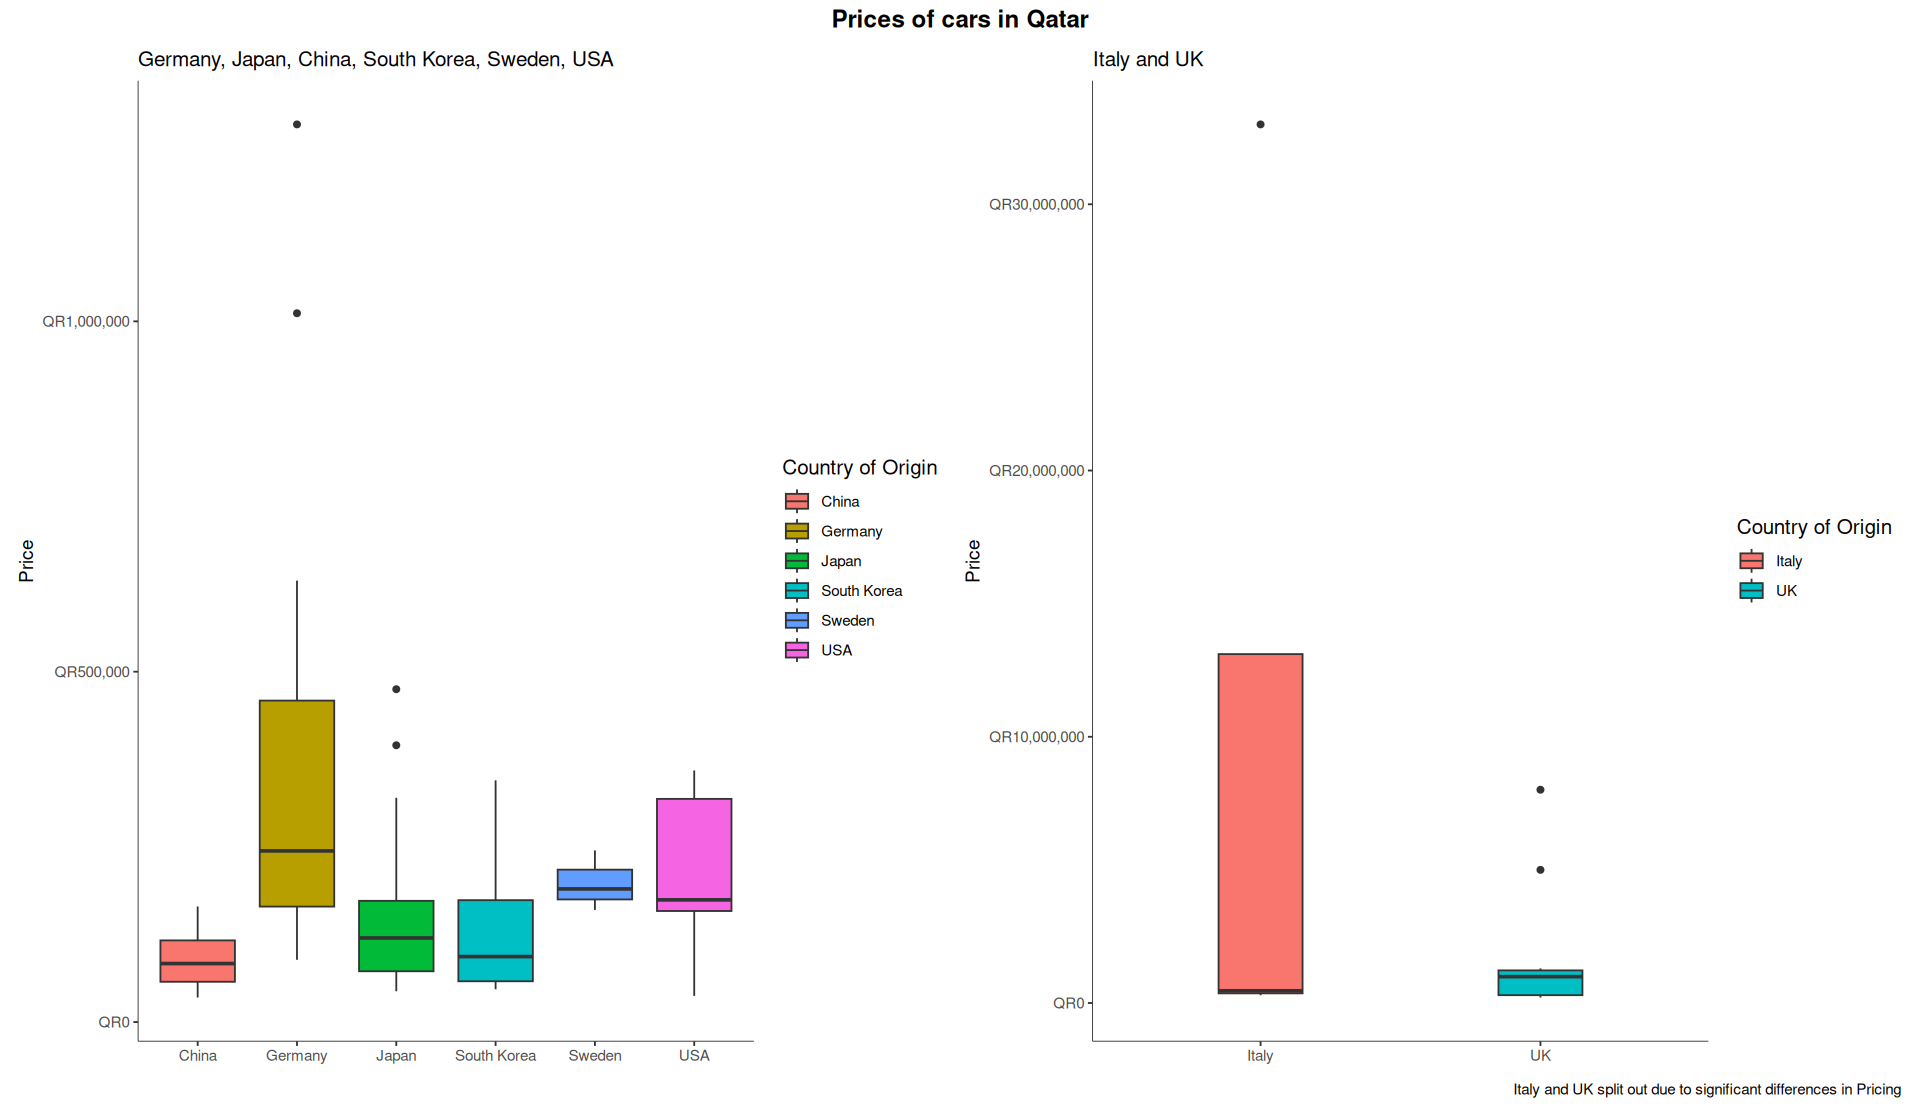
TidyTuesday Week 49: Qars-tar
9 Dec, 2025
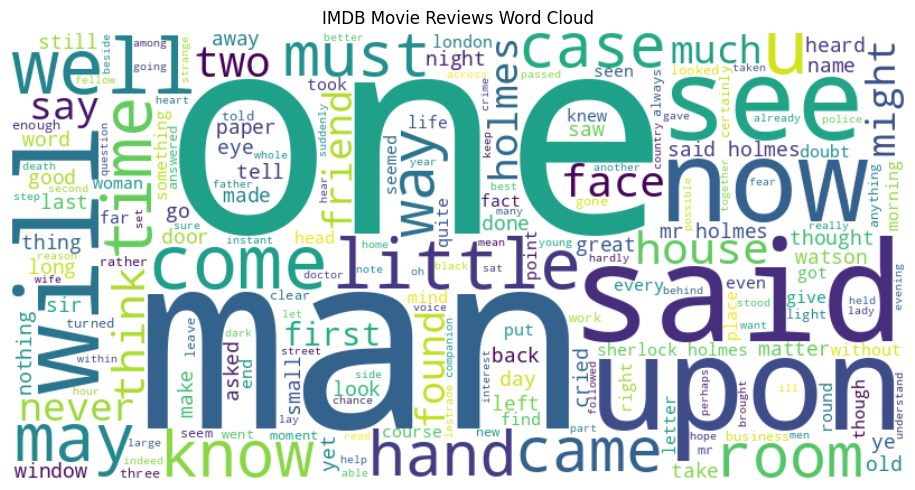
TidyTuesday Week 46: Sherlock Holmes
18 Nov, 2025
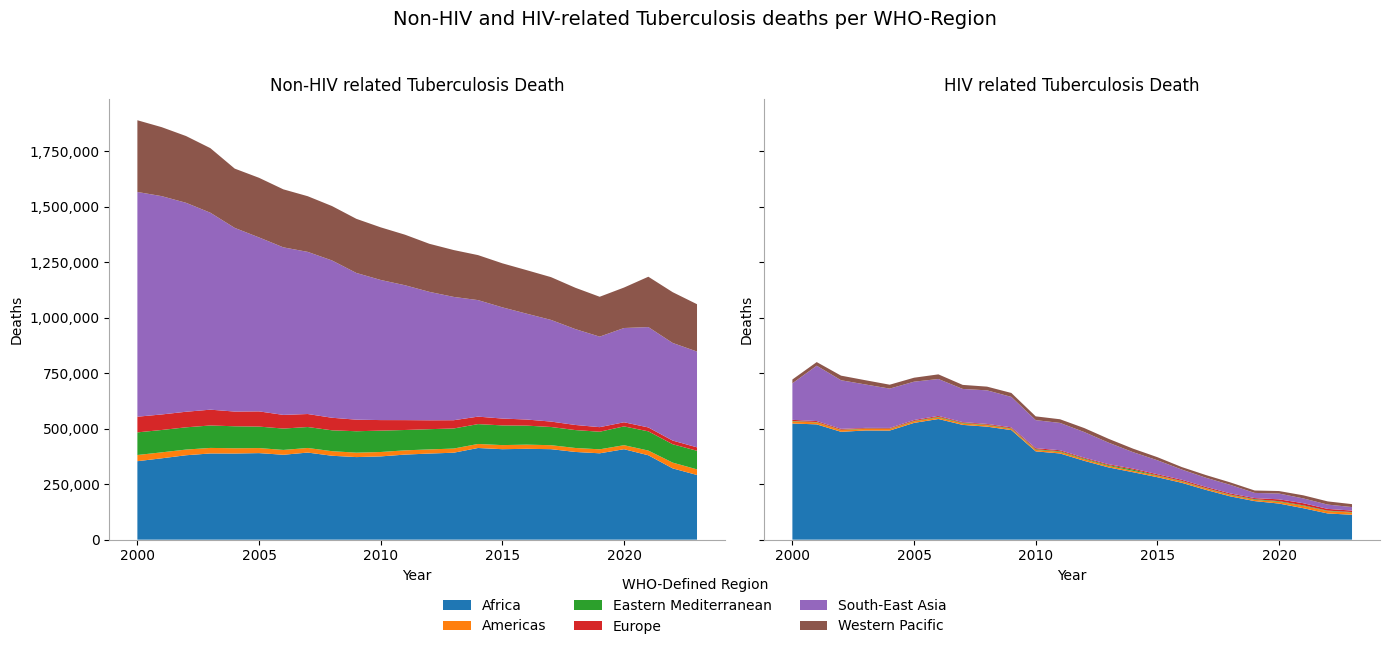
TidyTuesday Week 45: WHO TB Burden Data: Incidence, Mortality, and Population
11 Nov, 2025
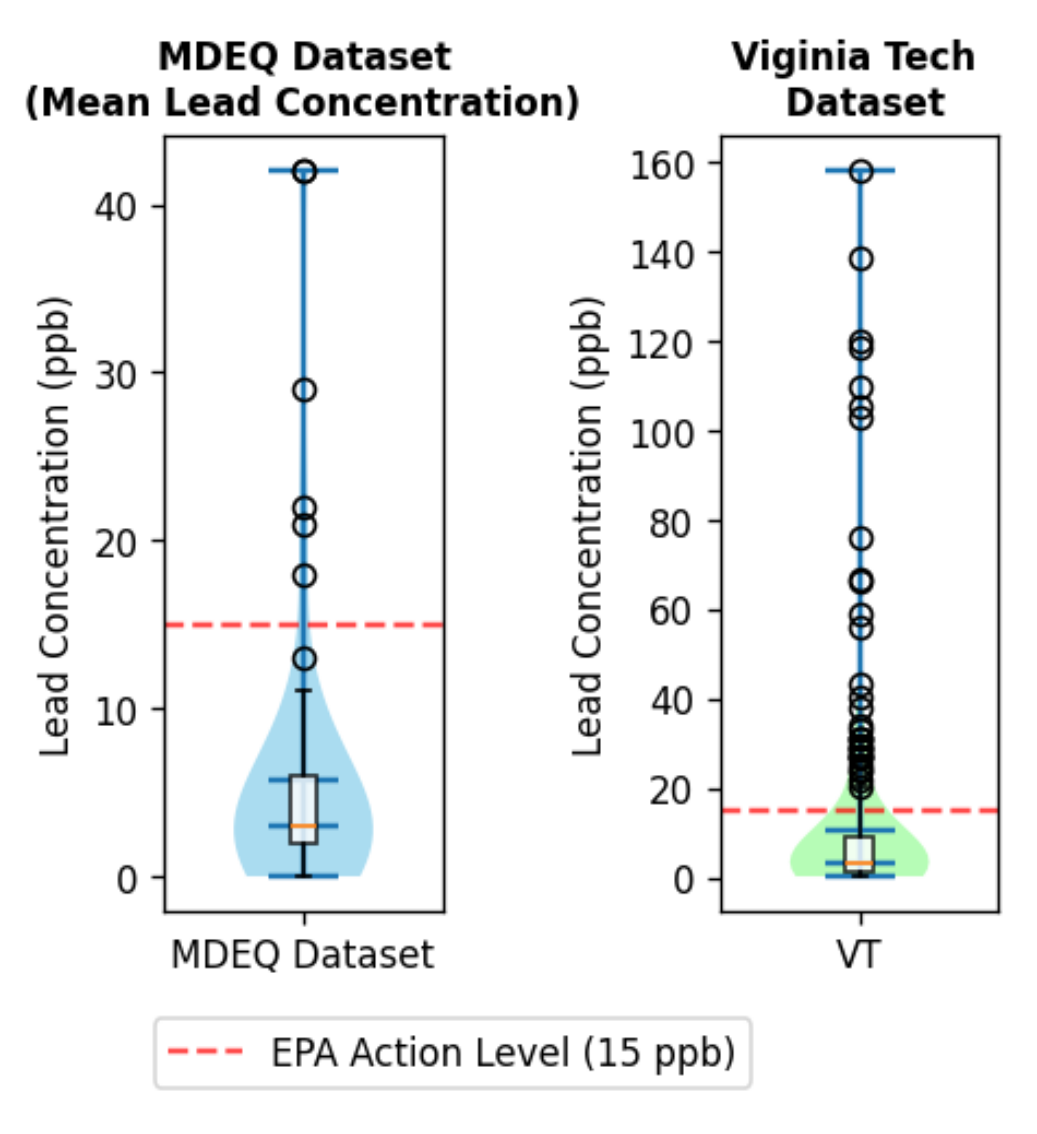
TidyTuesday Week 44: Lead Levels in the Drinking Water of Flint Michigan
6 Nov, 2025
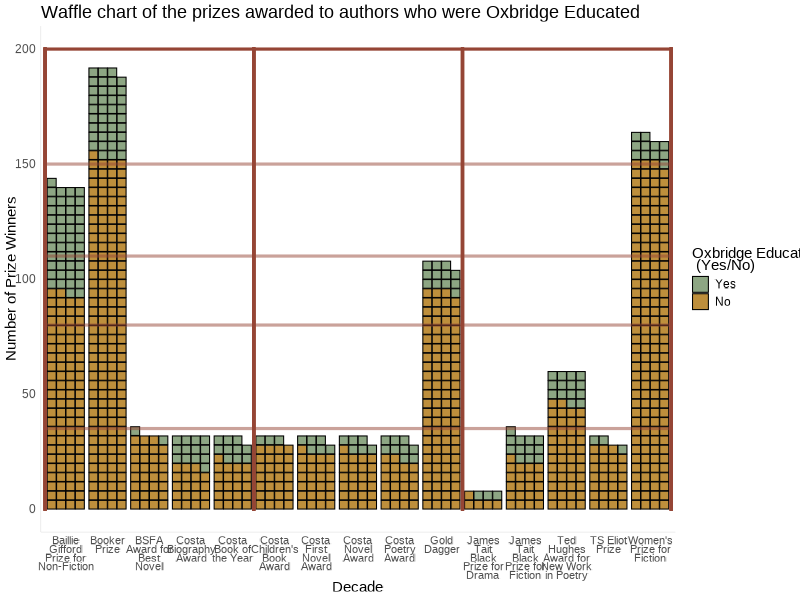
TidyTuesday Week 43: Selected British Literary Prizes (1990-2022)
29 Oct, 2025
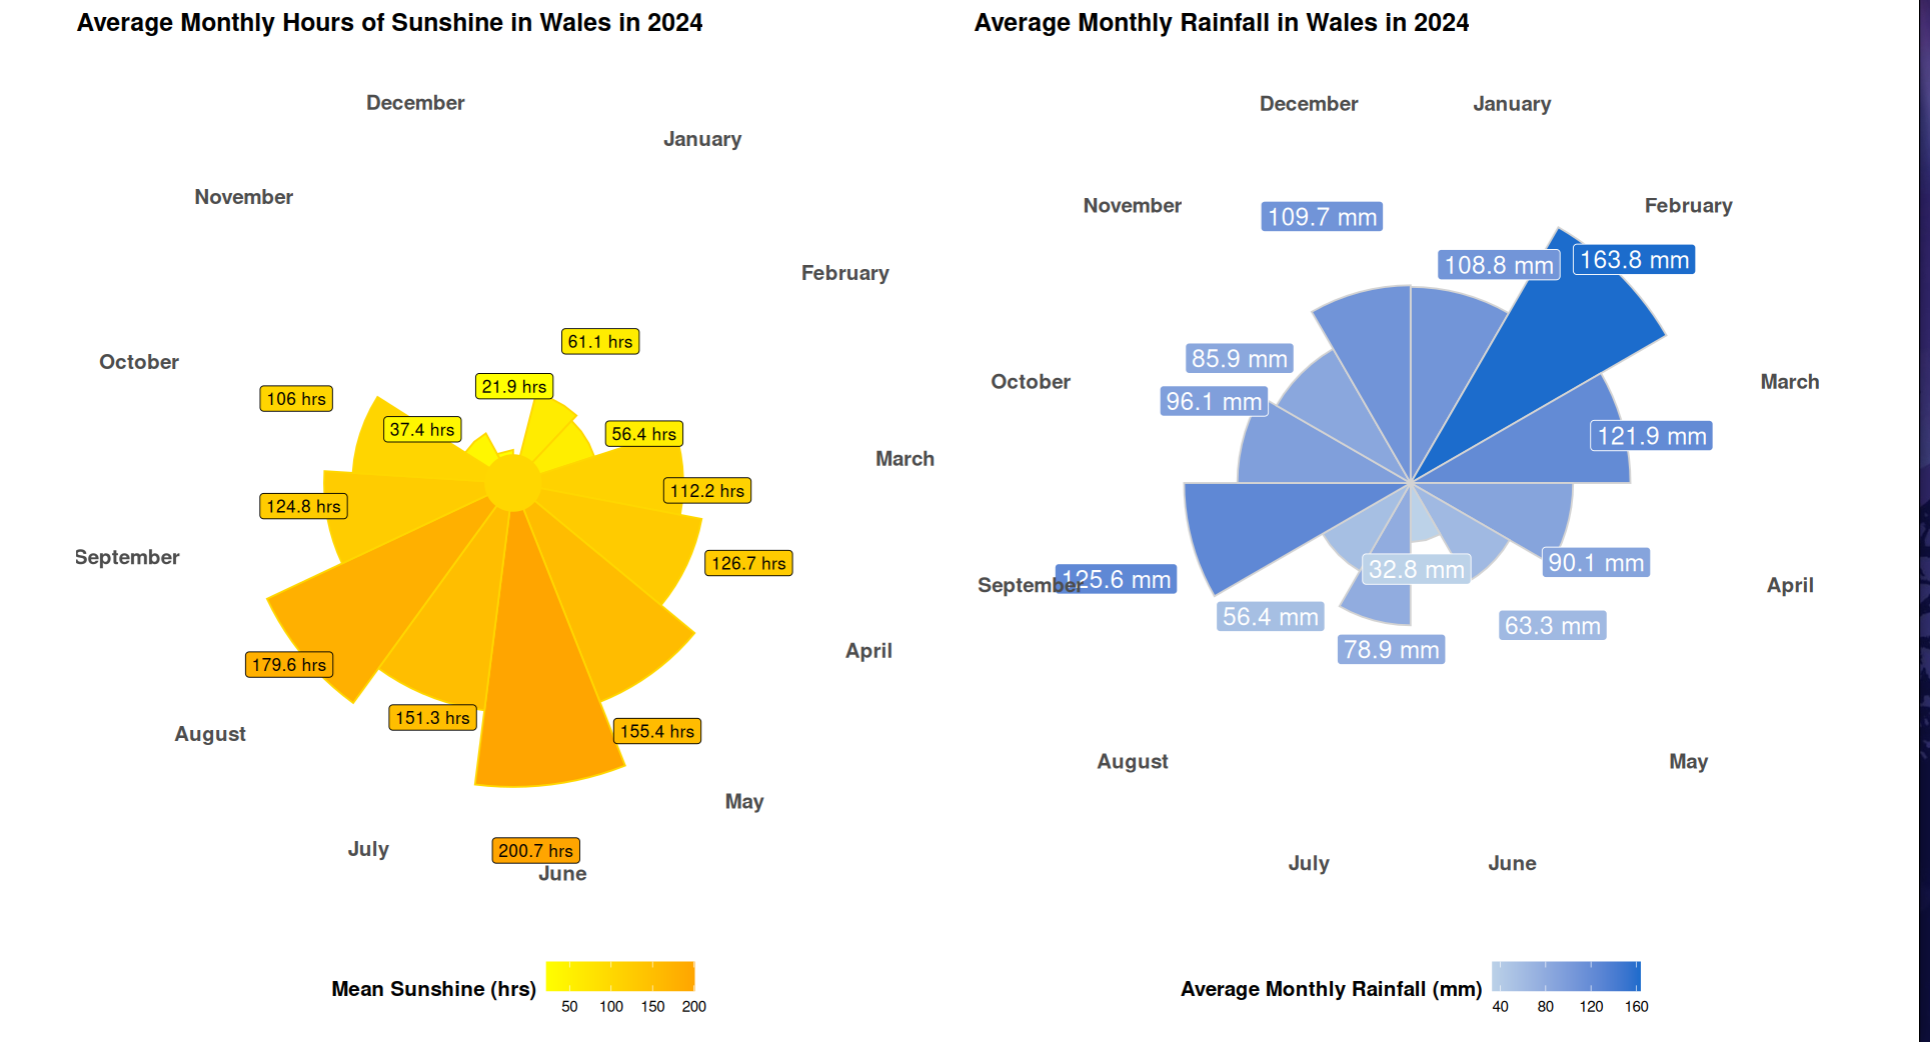
TidyTuesday Week 42: UK Historical Weather
23 Oct, 2025
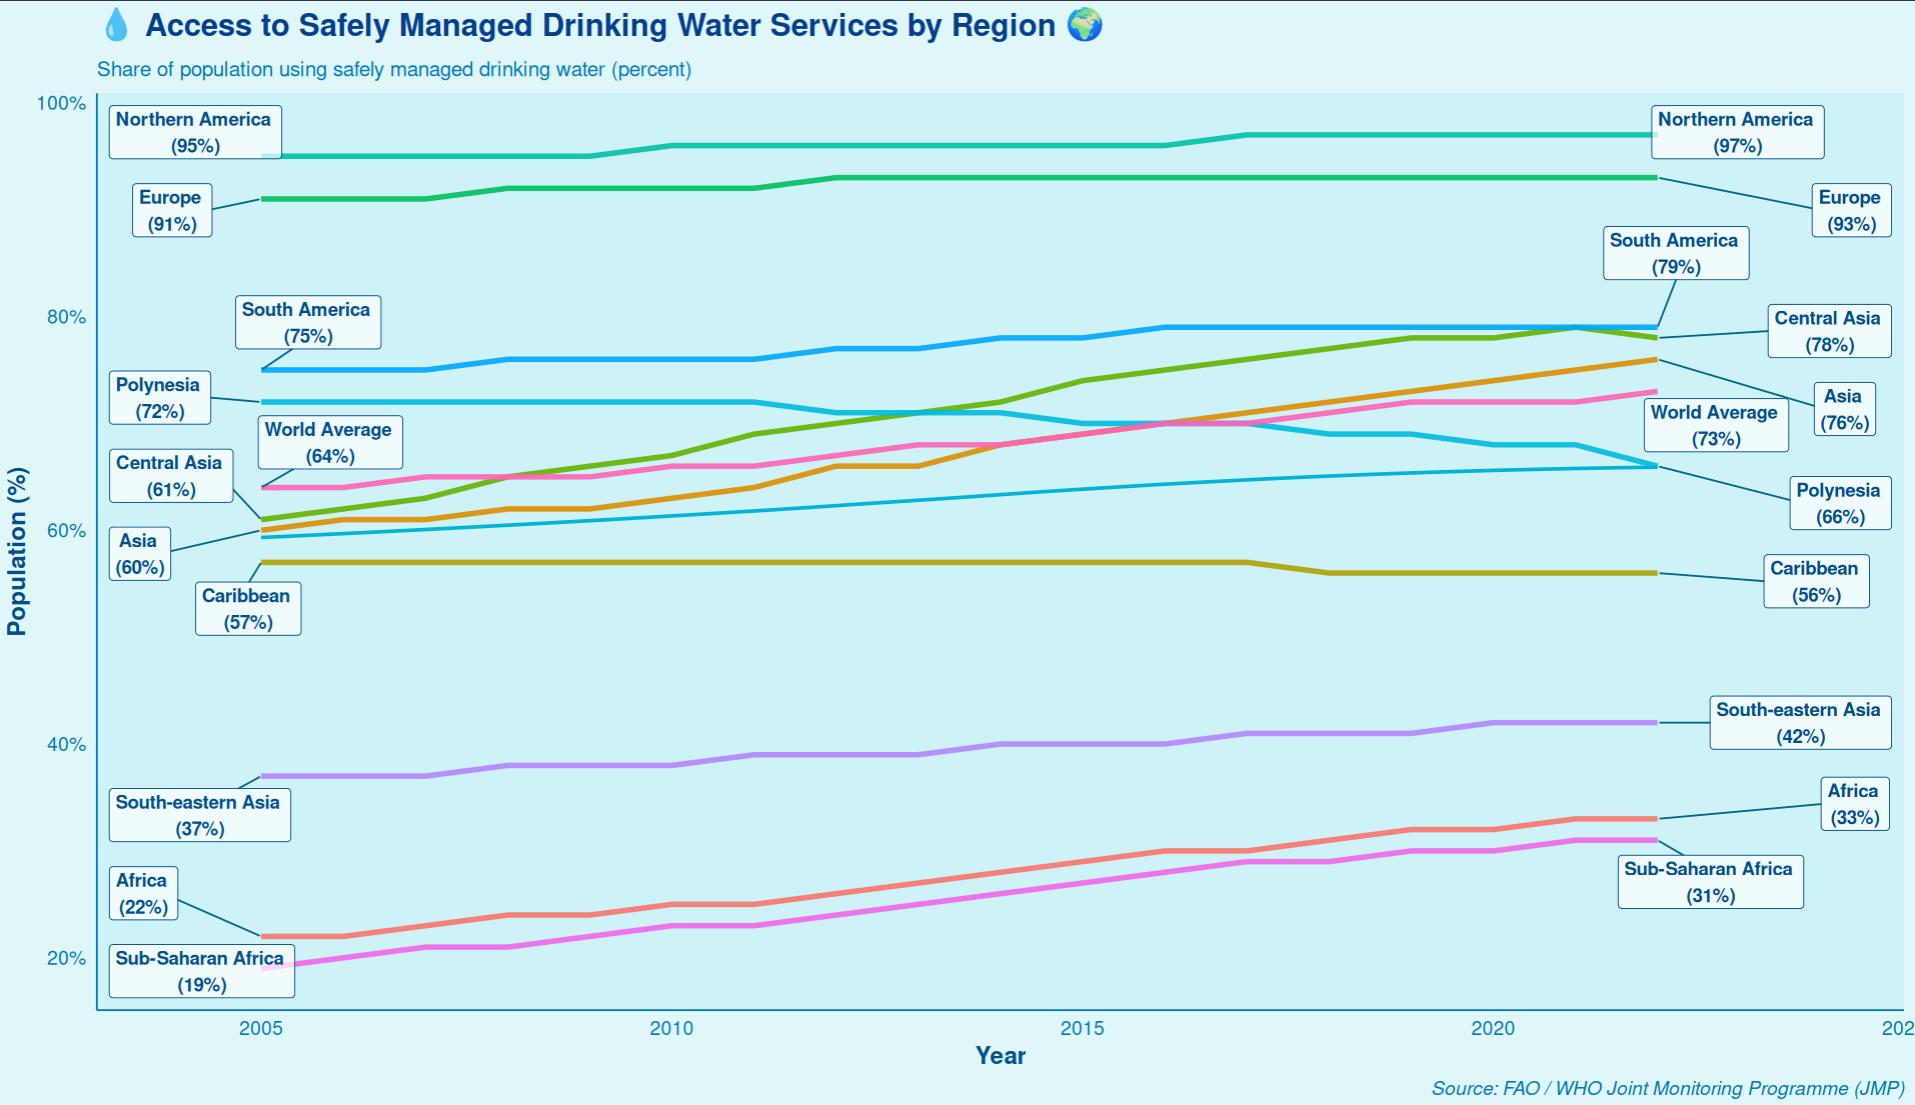
TidyTuesday Week 41: Food/Water Security
20 Oct, 2025
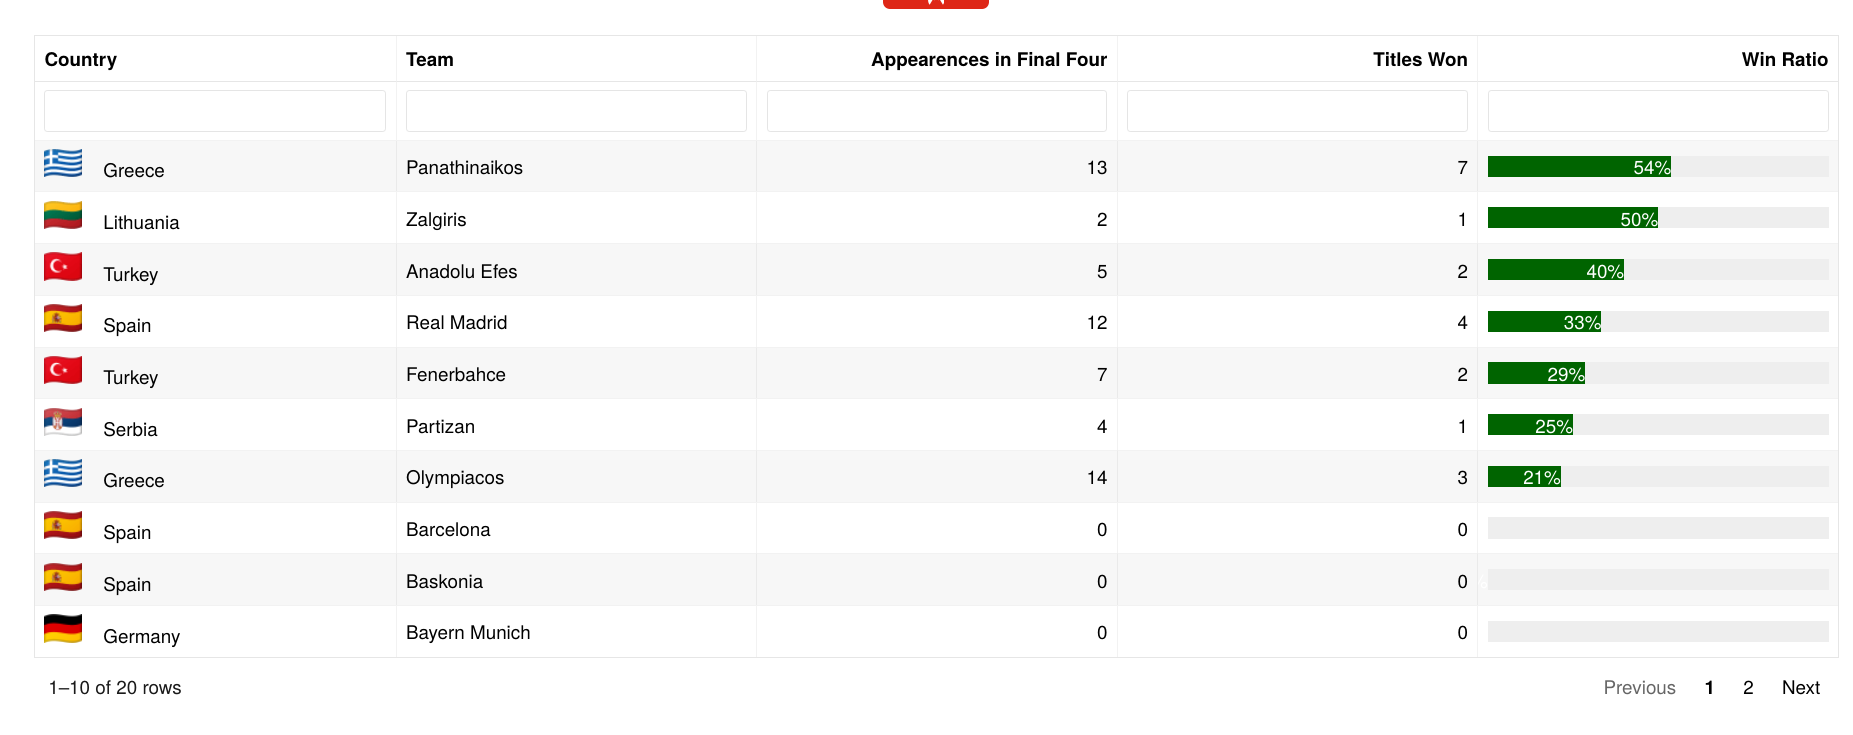
TidyTuesday Week 40: EuroLeague Basketball
14 Oct, 2025
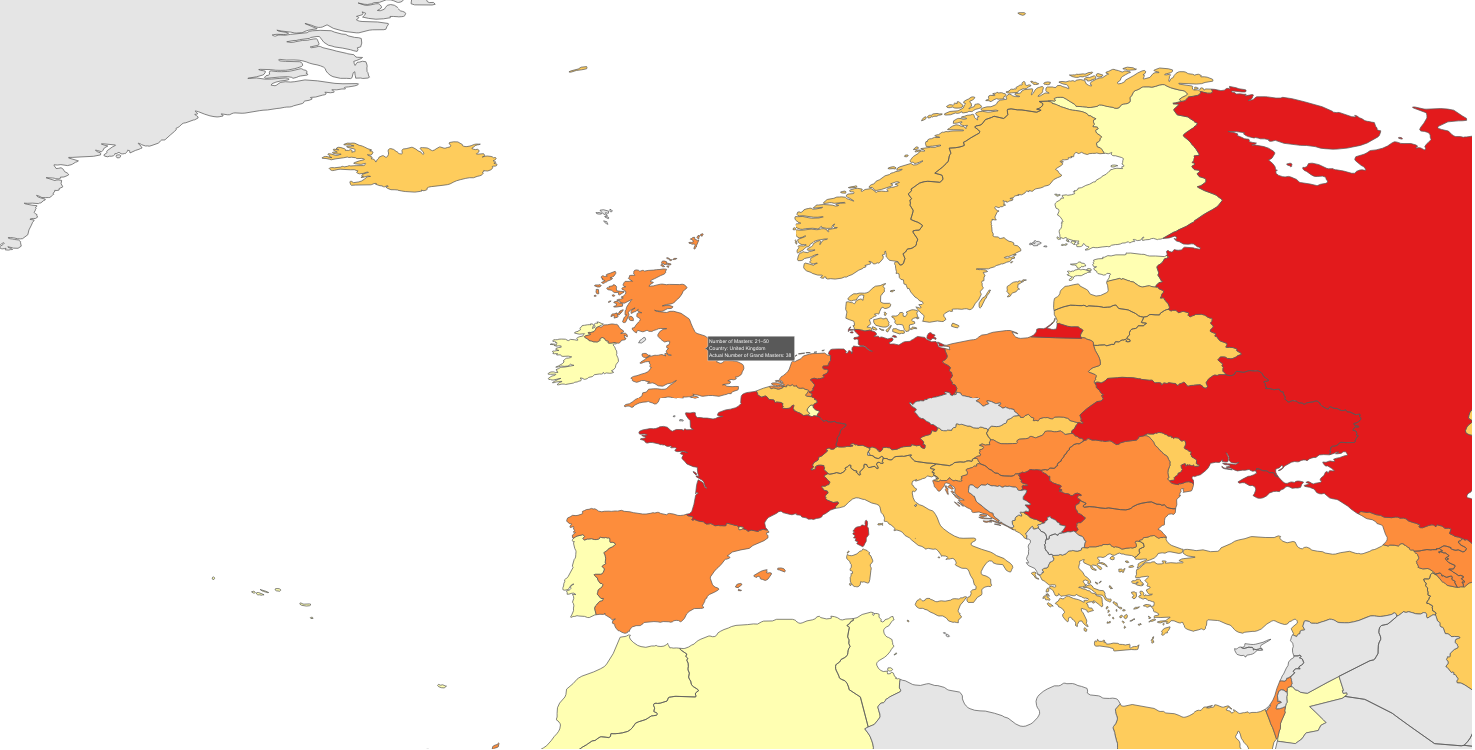
TidyTuesday Week 38: FIDE Chess Player Ratings
23 Sep, 2025
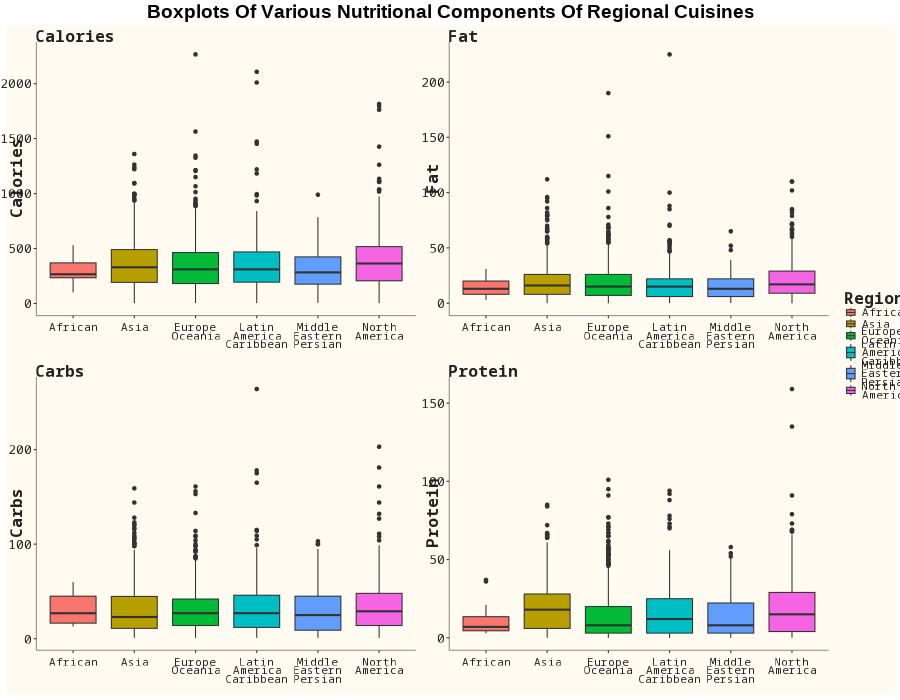
TidyTuesday Week 37: Allrecipes Data
15 Sep, 2025
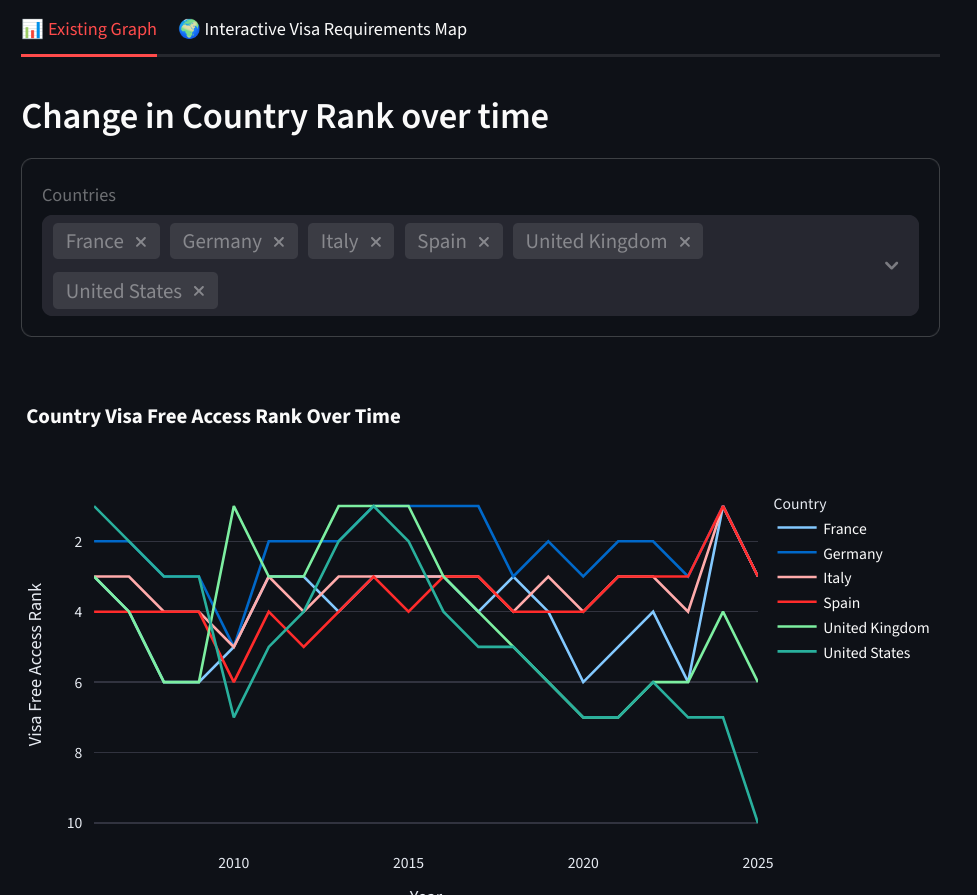
TidyTuesday Week 36: Henley Passport Index Data
8 Sep, 2025
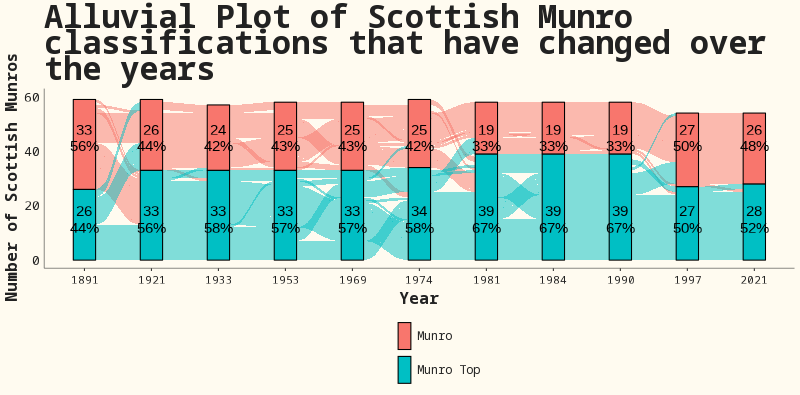
TidyTuesday Week 33: Scottish Munros
19 Aug, 2025
TidyTuesday Week 34: Billboard Hot 100 Number Ones
19 Aug, 2025
TidyTuesday Week 31: Income Inequality before and after taxes
5 Aug, 2025
TidyTuesday Week 32: Extreme Weather Attribution Studies
5 Aug, 2025
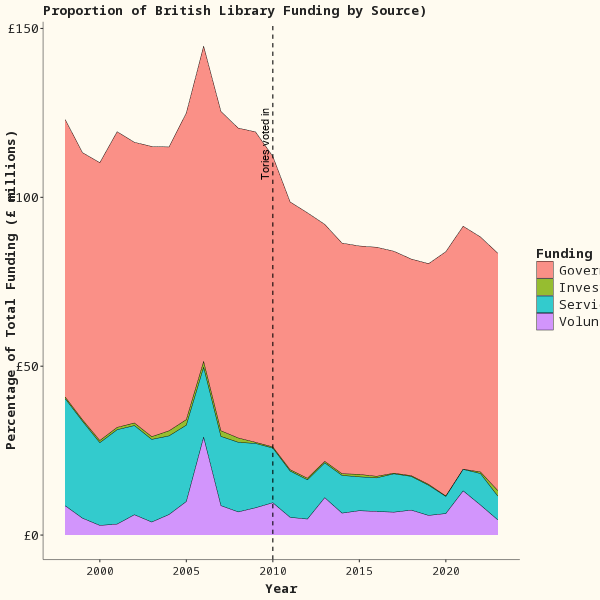
TidyTuesday Week 29: British Library Funding
15 Jul, 2025
TidyTuesday Week 28: British Library Funding
15 Jul, 2025
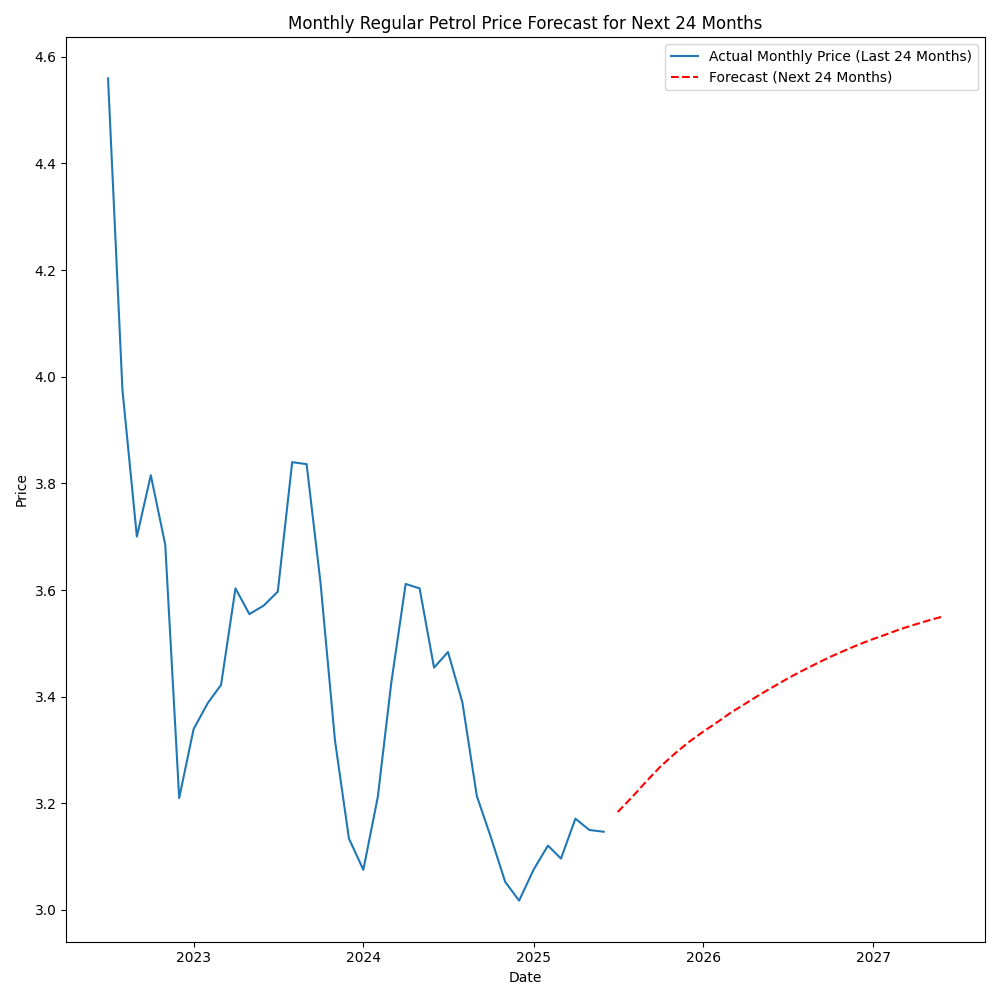
TidyTuesday Week 27: US Petrol Prices
8 Jul, 2025
TidyTuesday Week 26: US Petrol Prices
1 Jul, 2025
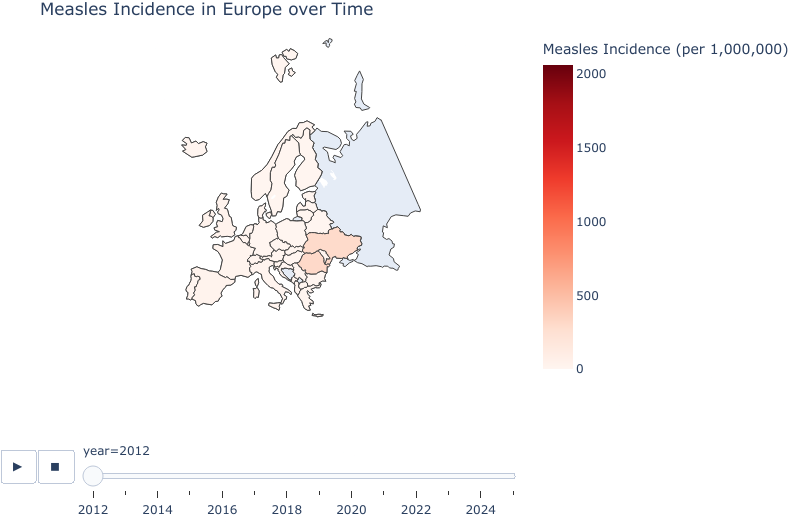
TidyTuesday Week 25: Measles cases across the world
24 Jun, 2025
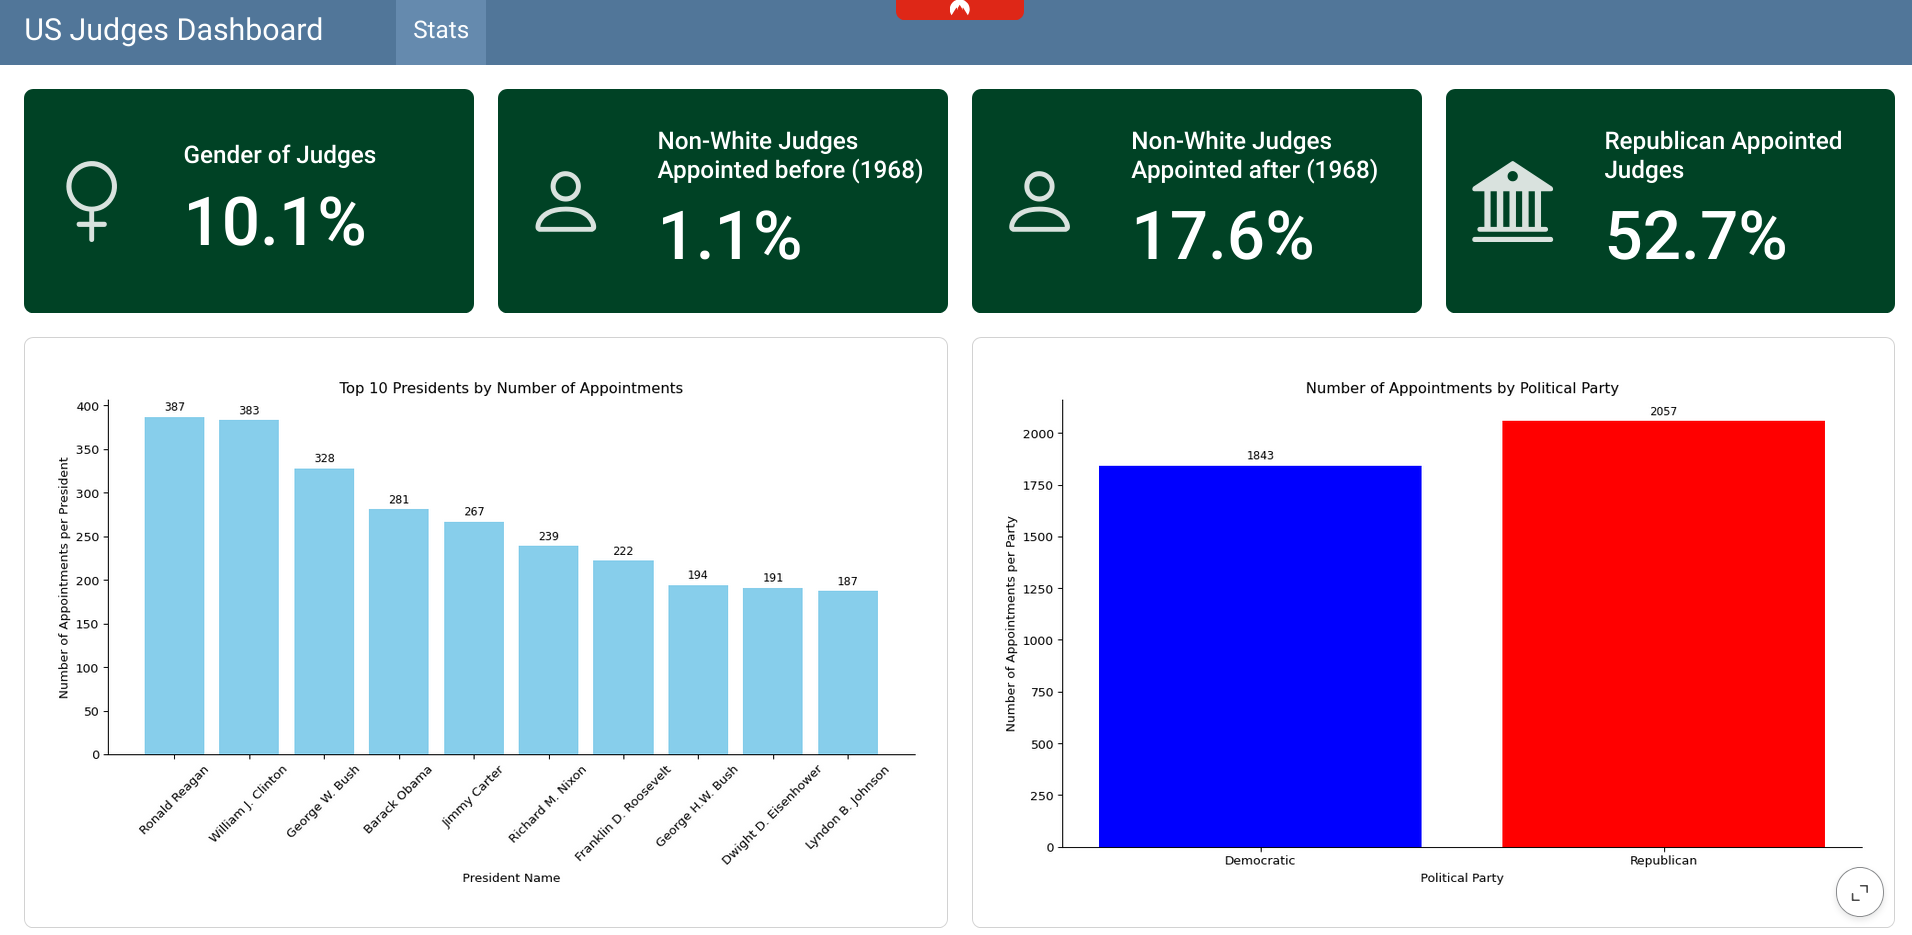
TidyTuesday Week 23: US Judges
15 Jun, 2025
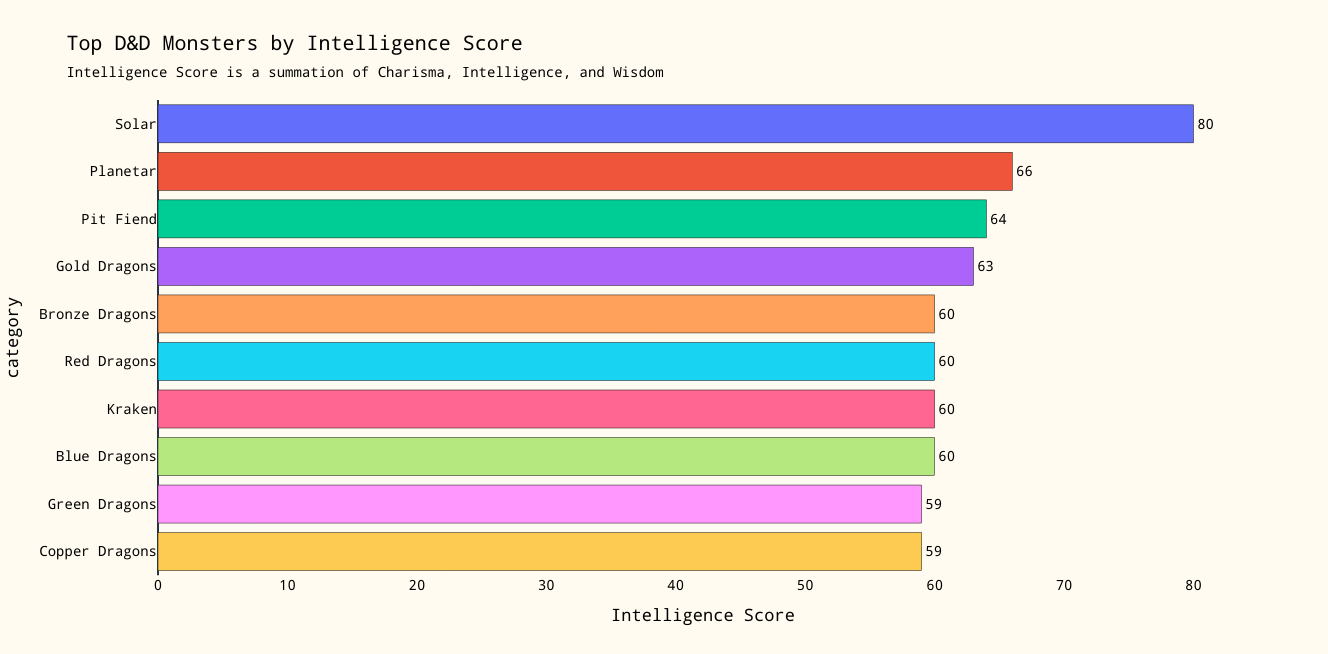
TidyTuesday Week 21: Dungeons and Dragons Monsters (2024)
27 May, 2025
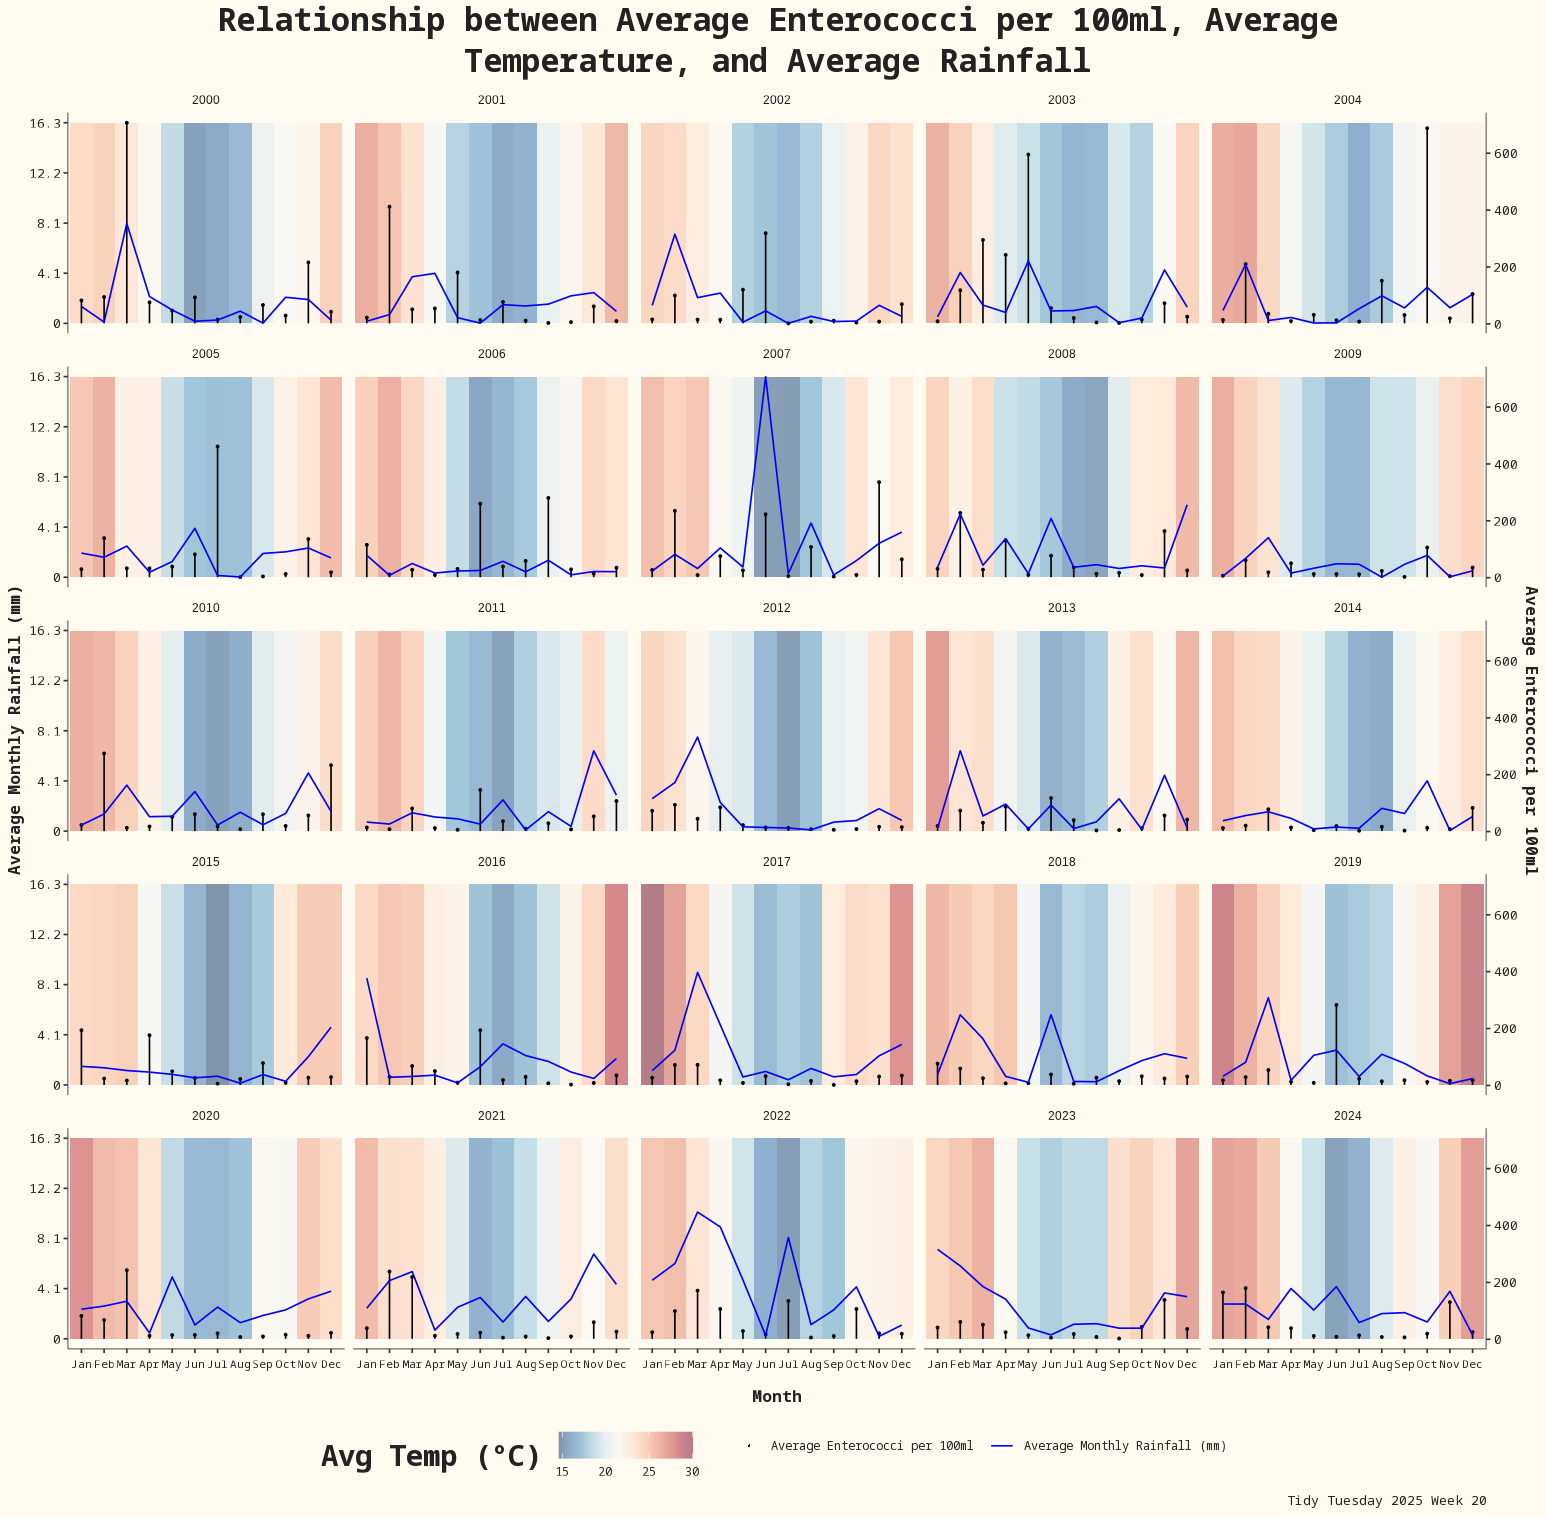
TidyTuesday Week 20: Water Quality at Sydney Beaches
20 May, 2025
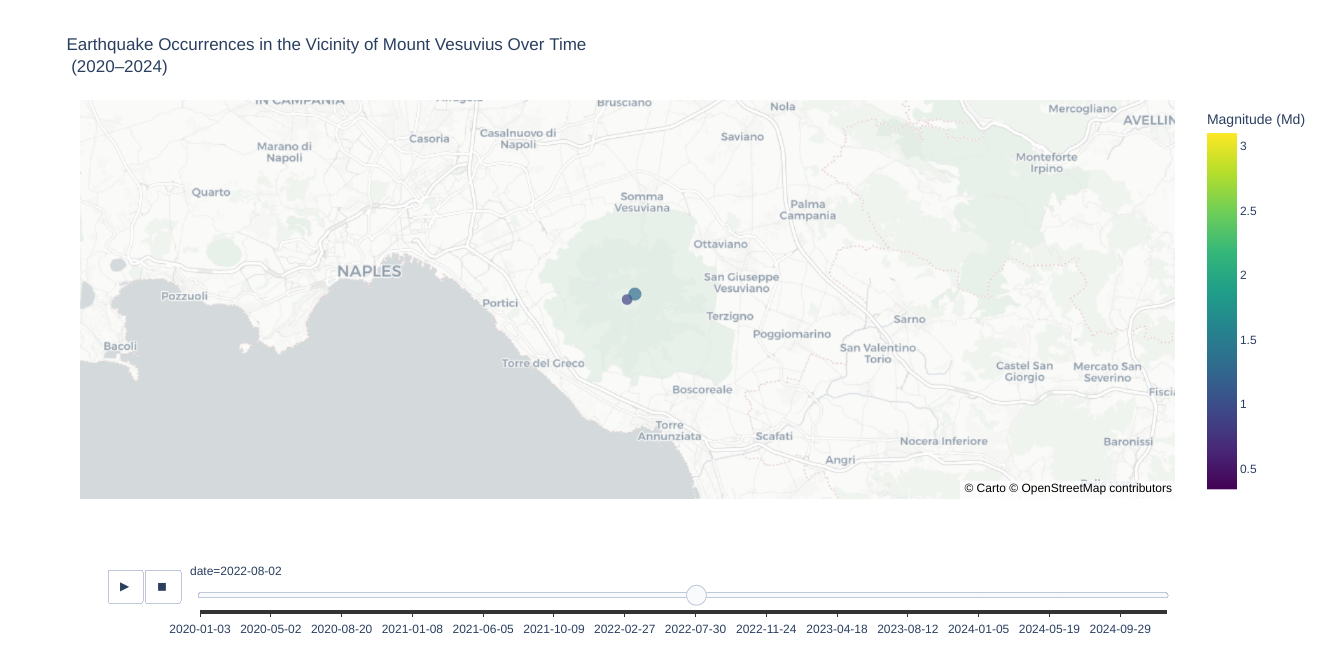
TidyTuesday Week 19: Seismic Events at Mount Vesuvius
12 May, 2025
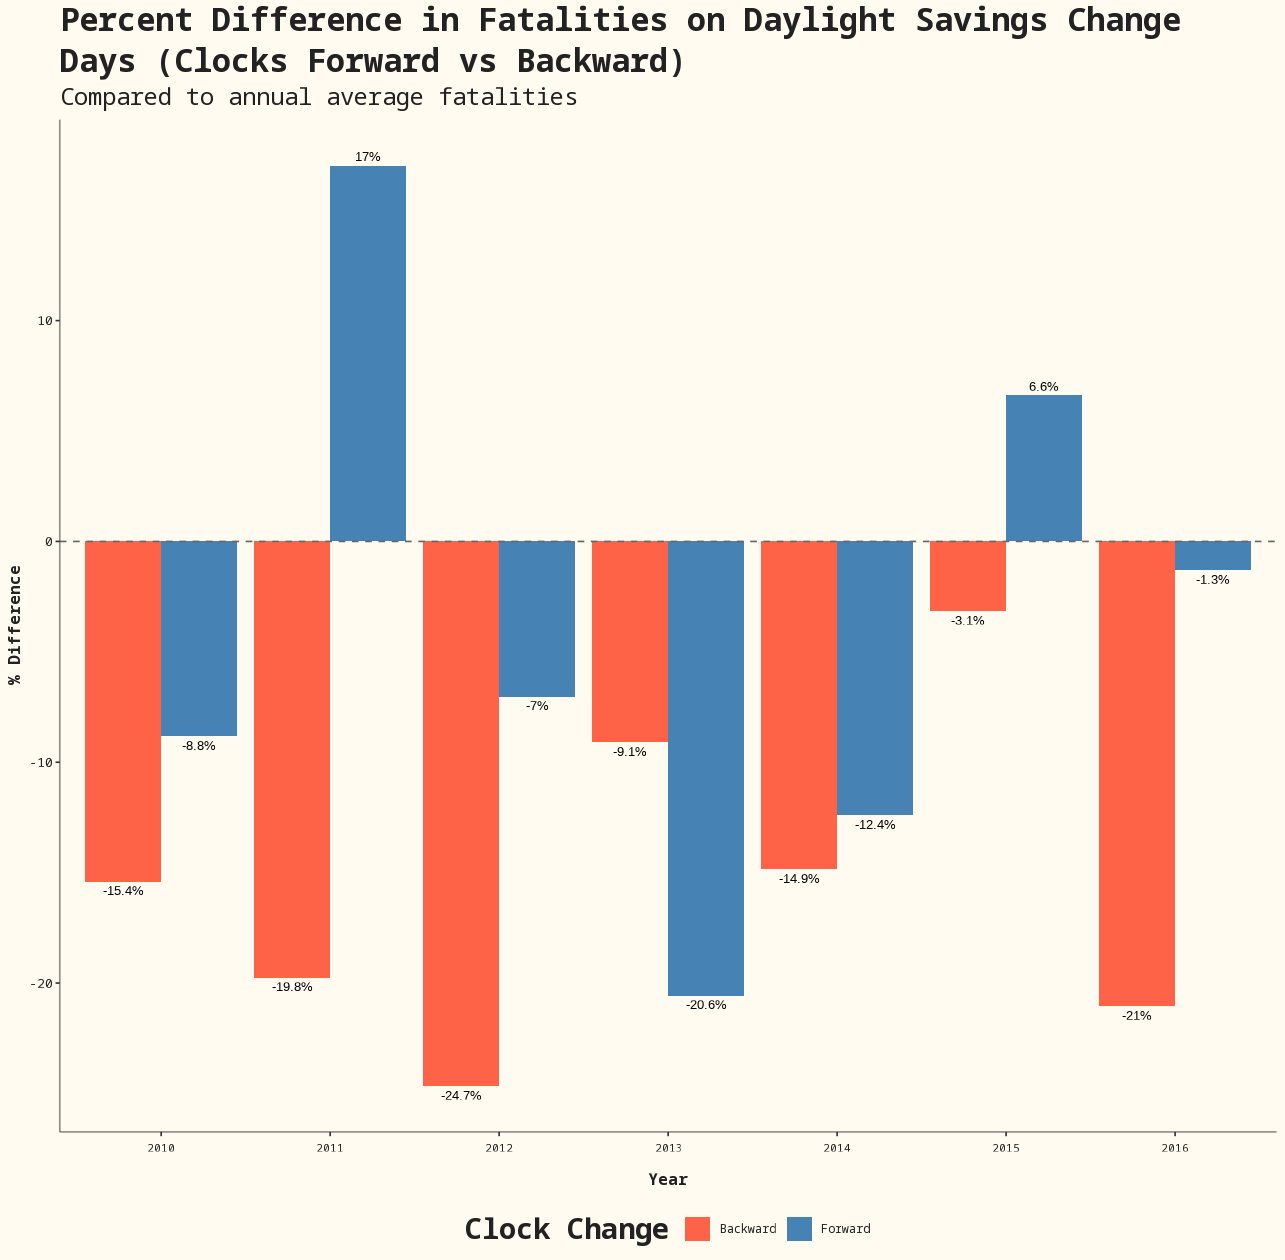
TidyTuesday Week 16: Fatal Car Crashes on DST days
21 Apr, 2025
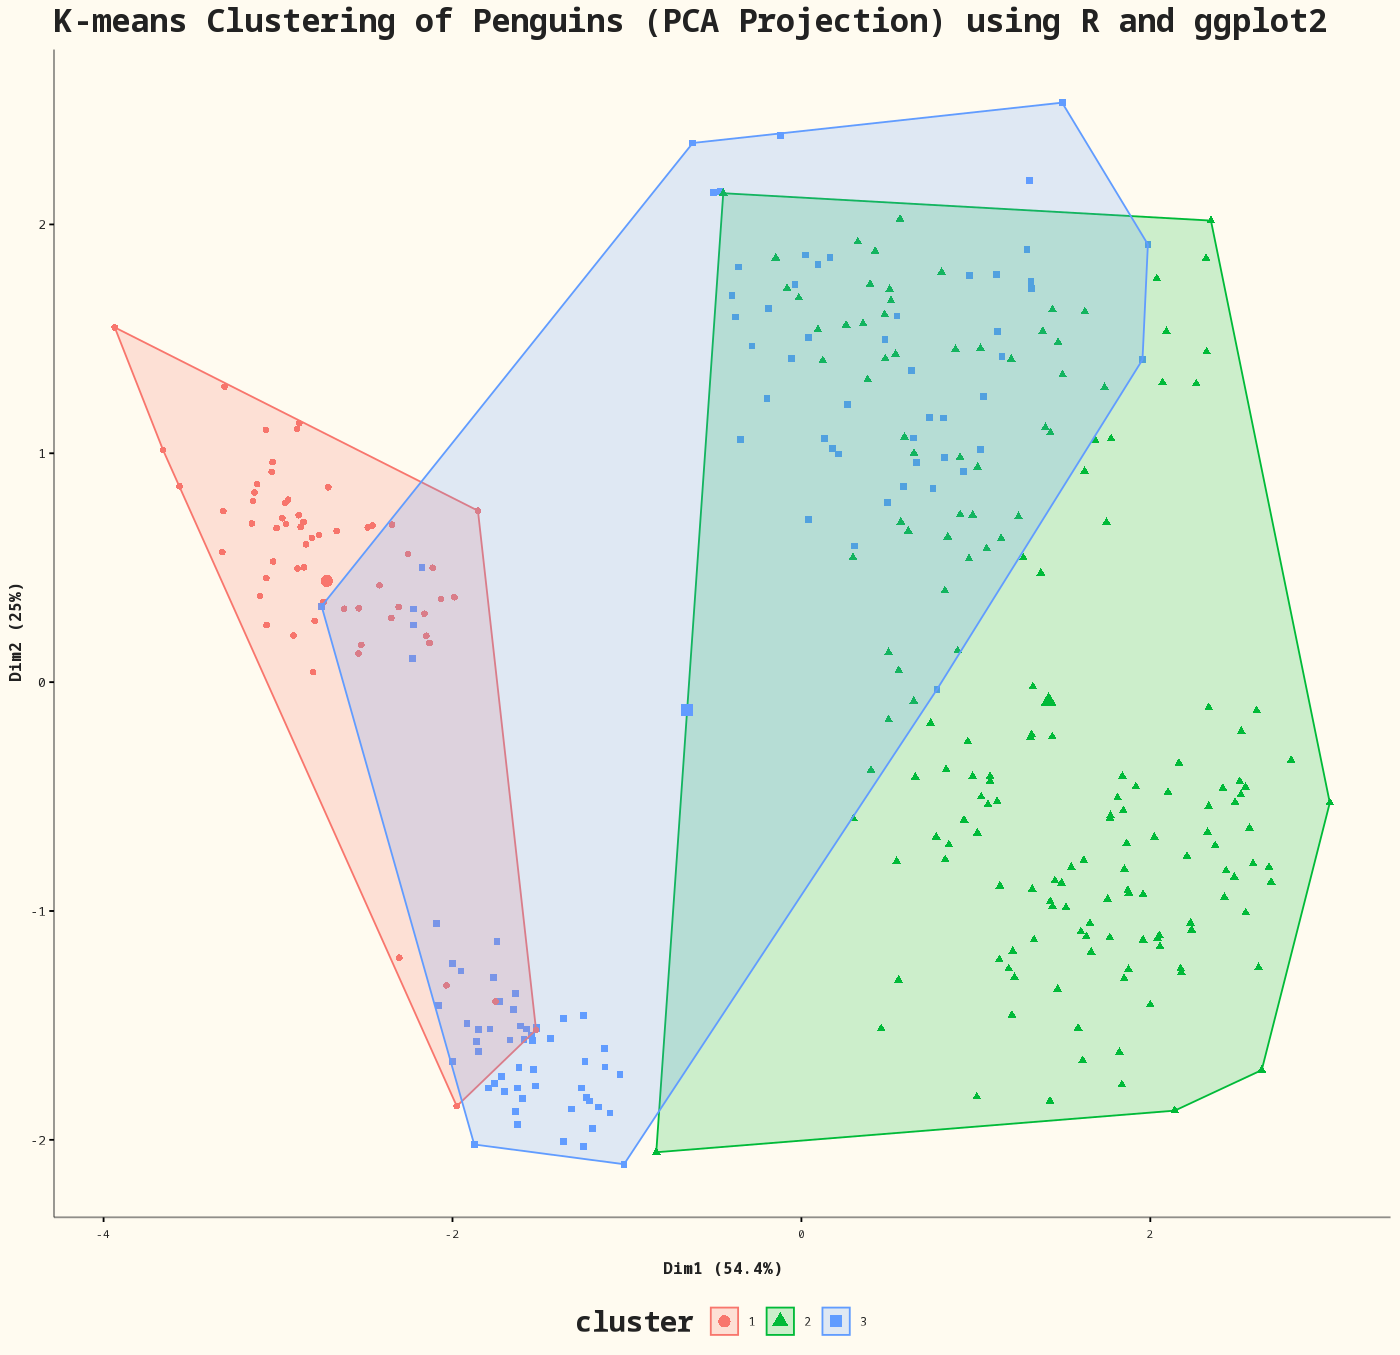
TidyTuesday Week 15: Penguins
16 Apr, 2025
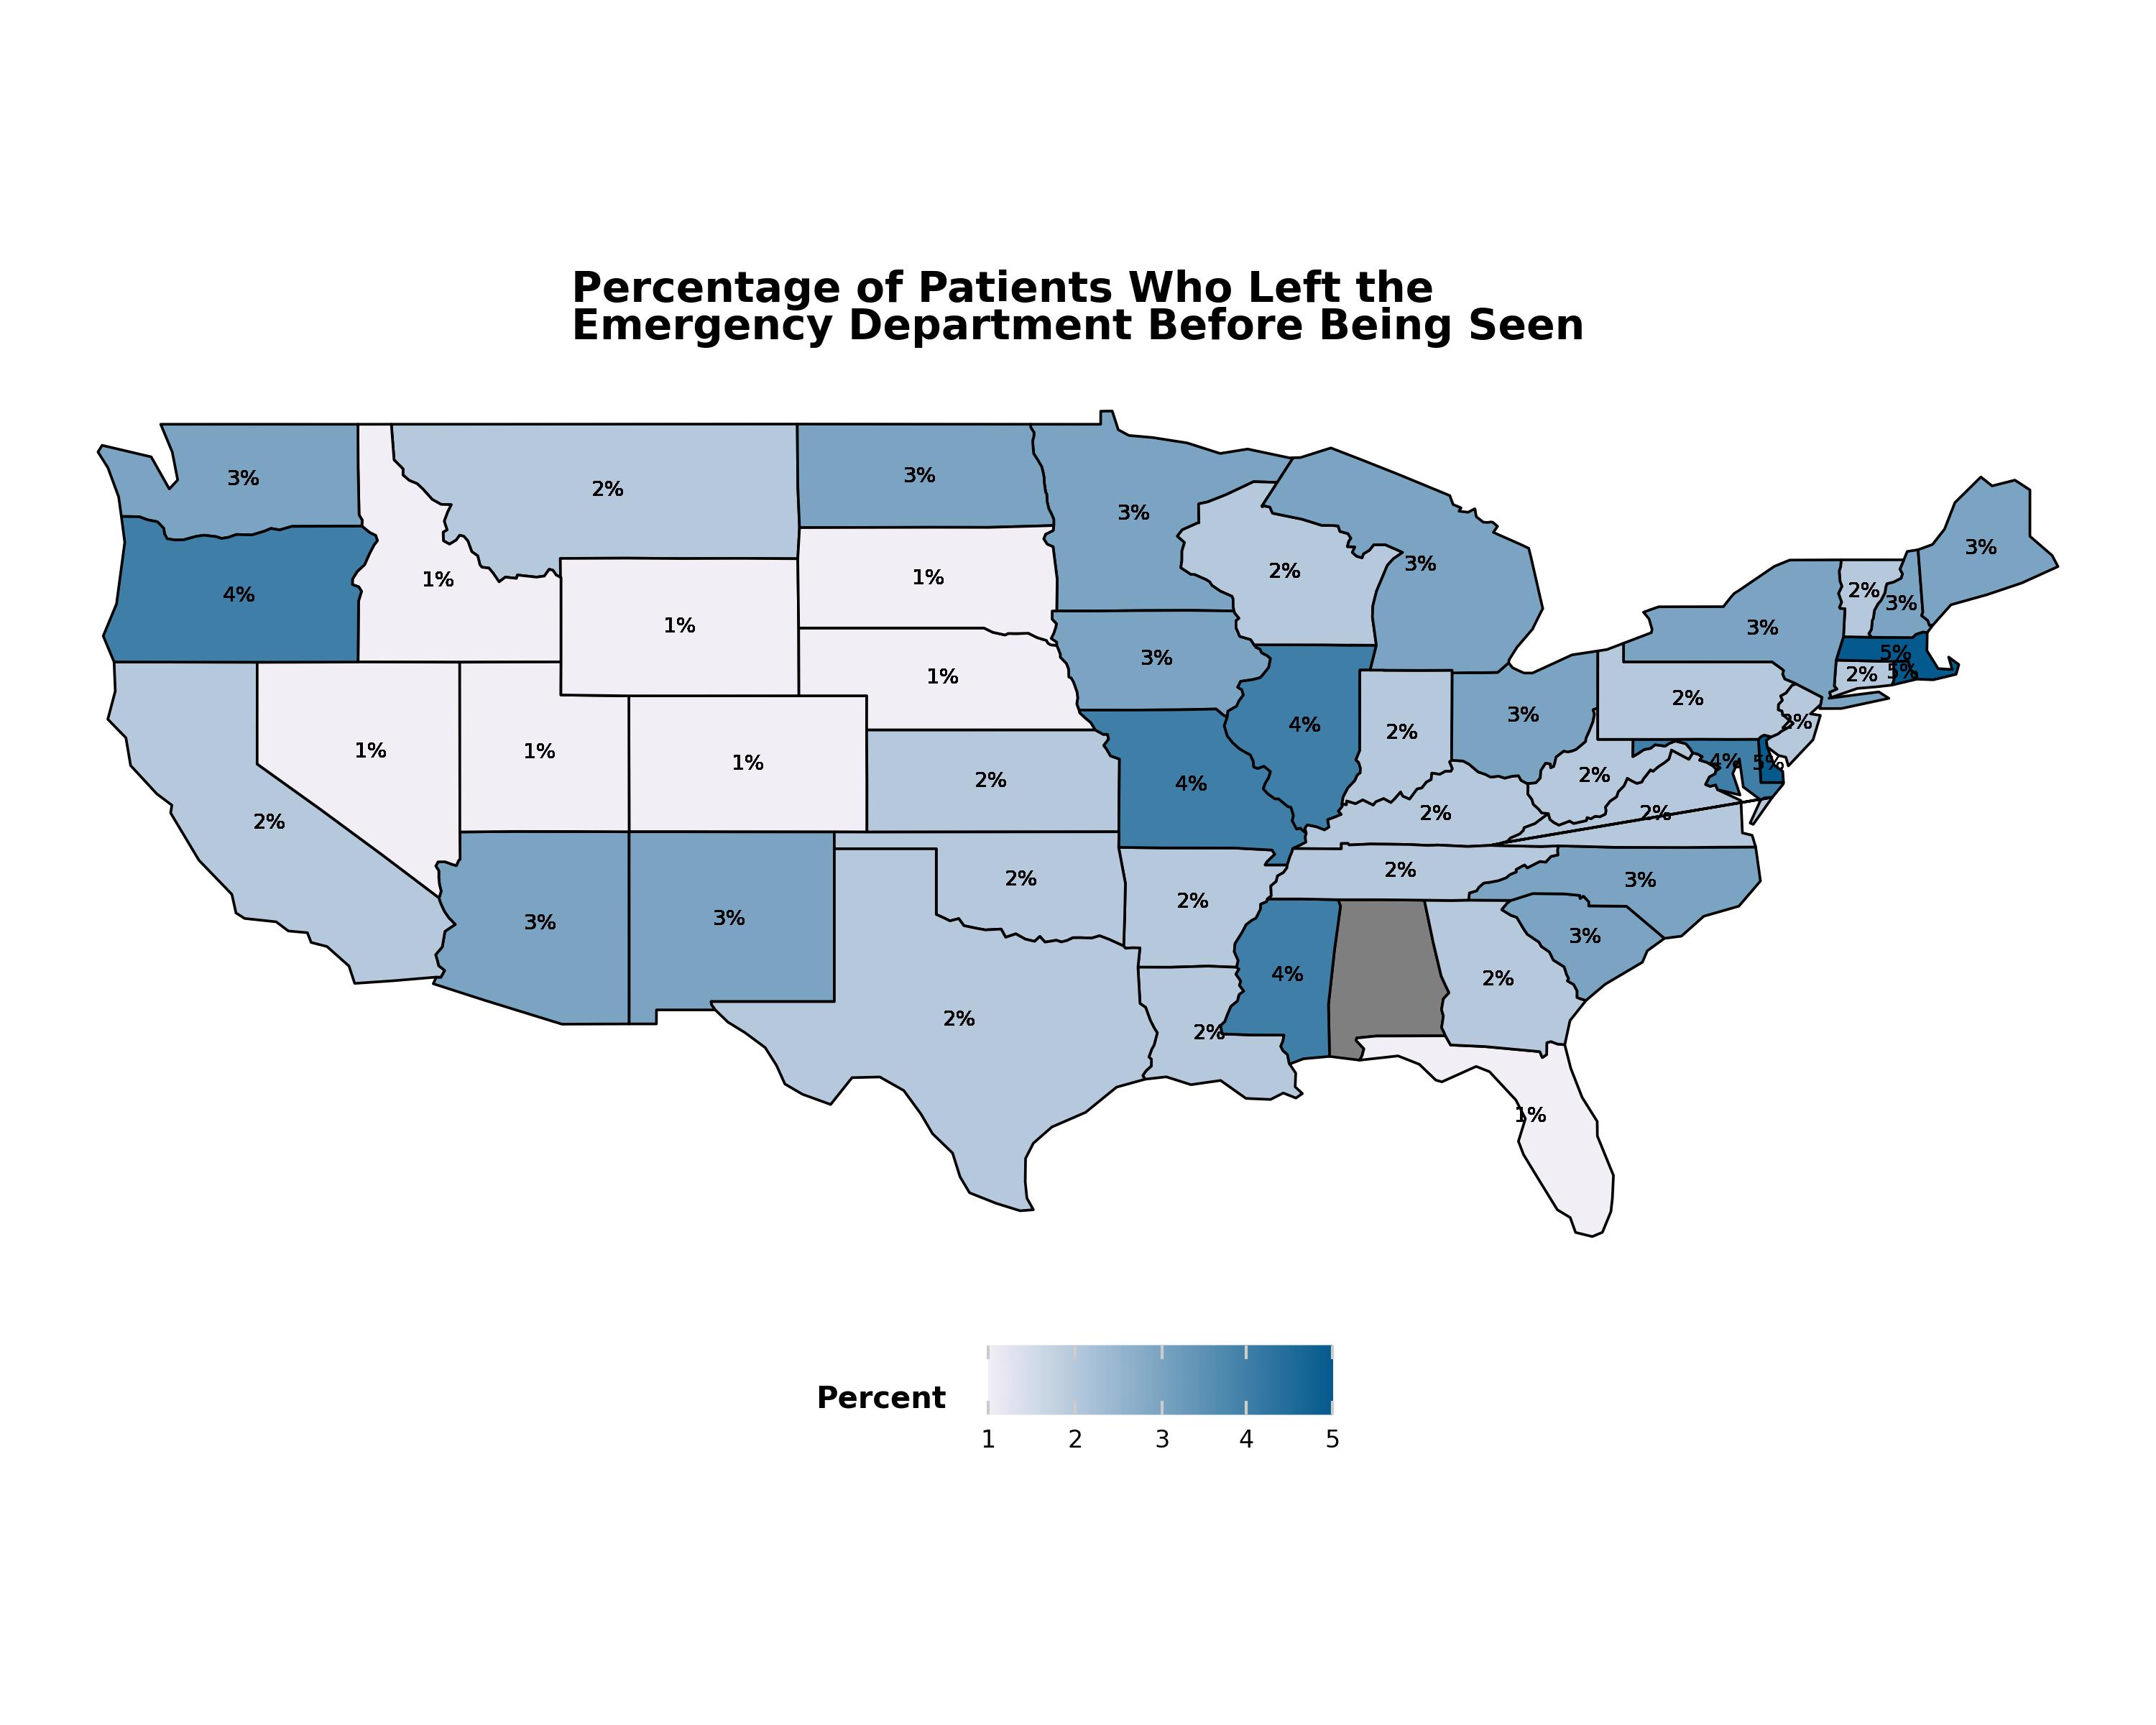
TidyTuesday Week 14: Timely and Effective Care by US State
8 Apr, 2025
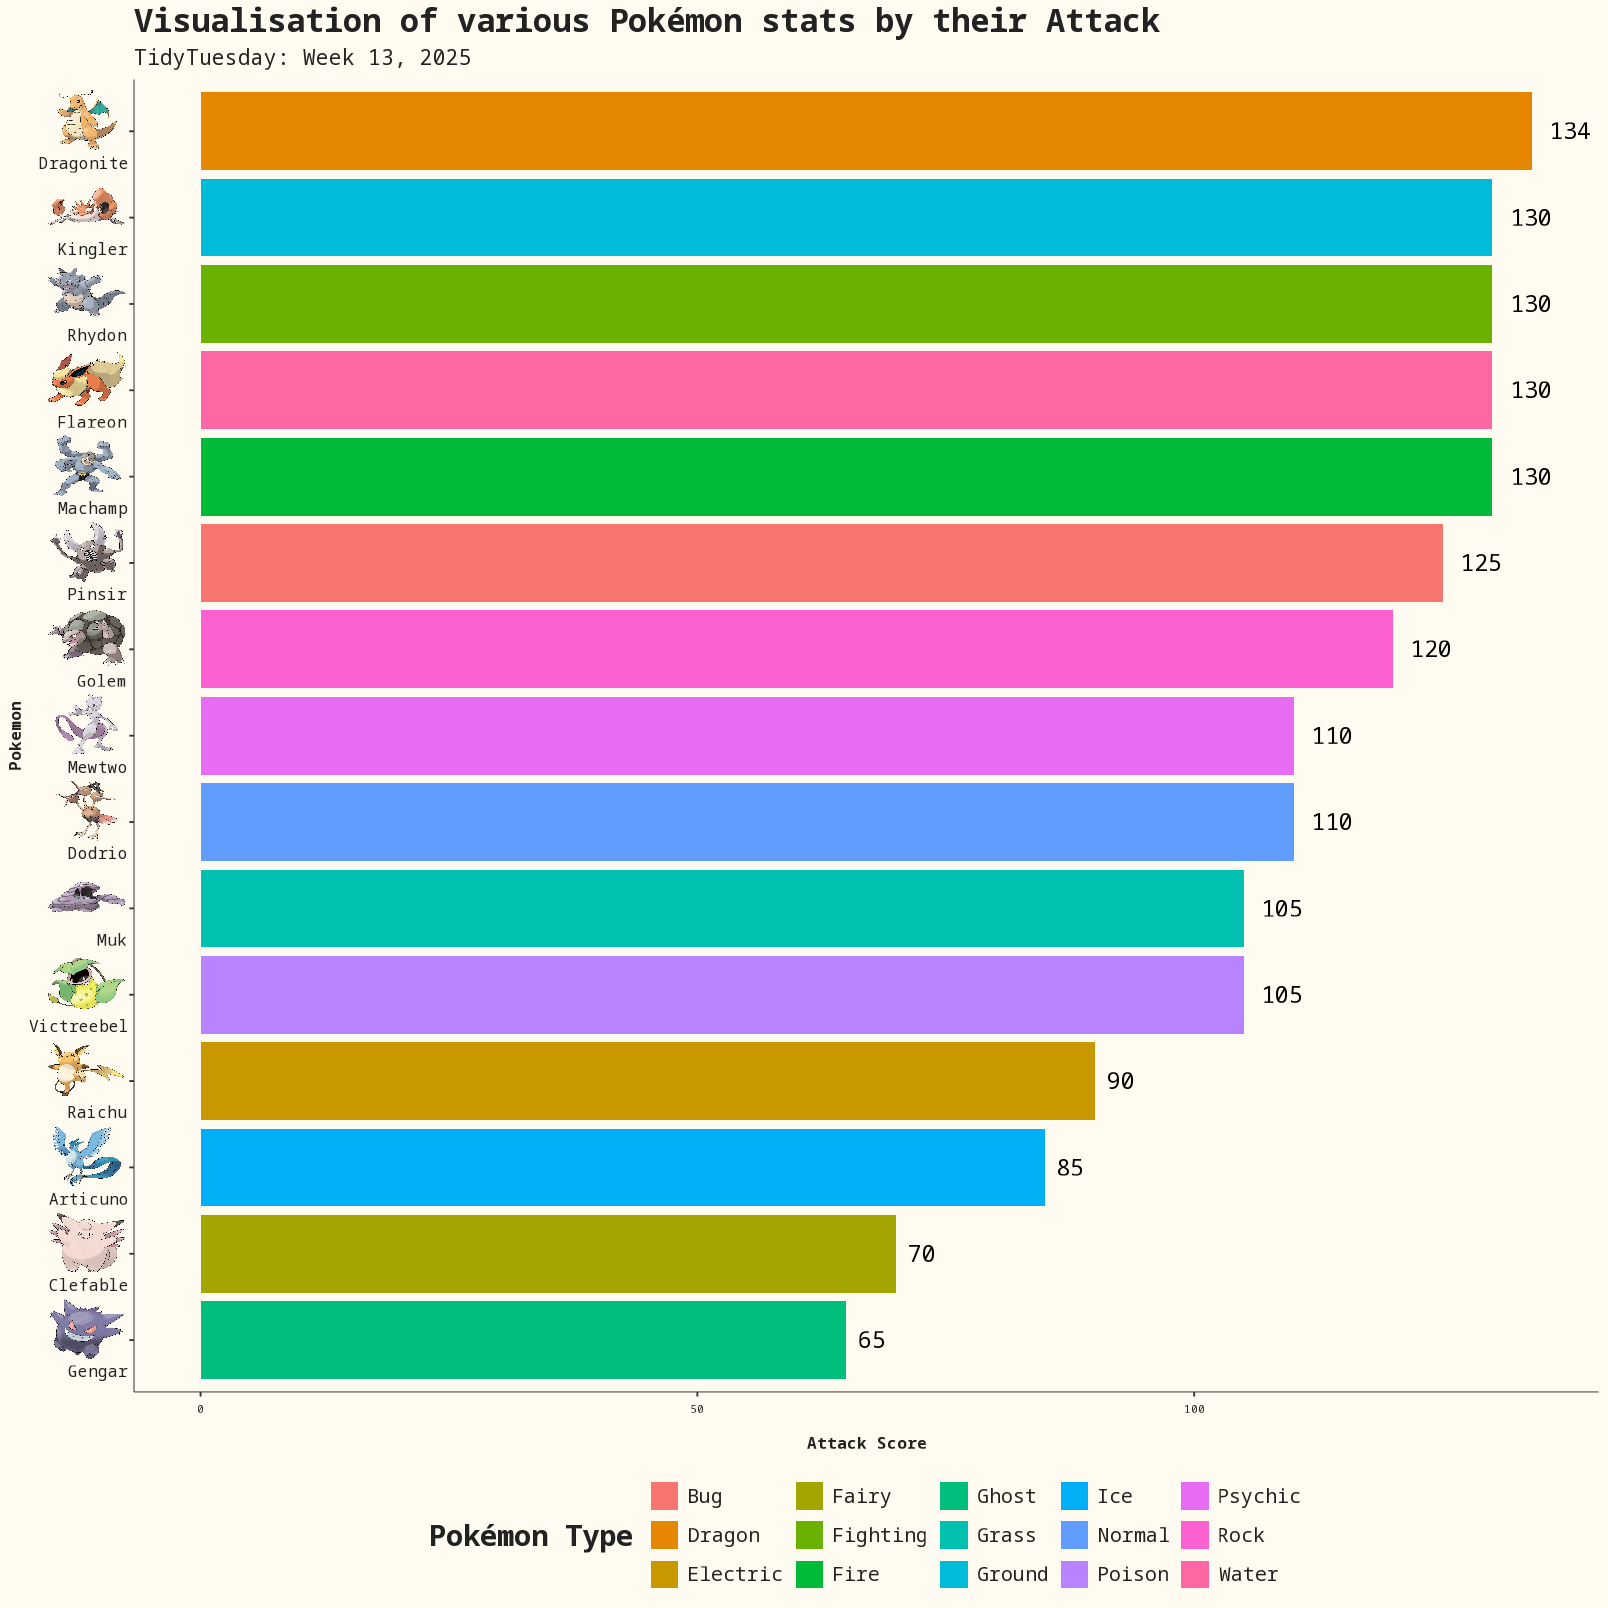
TidyTuesday Week 13: Pokemon
30 Mar, 2025
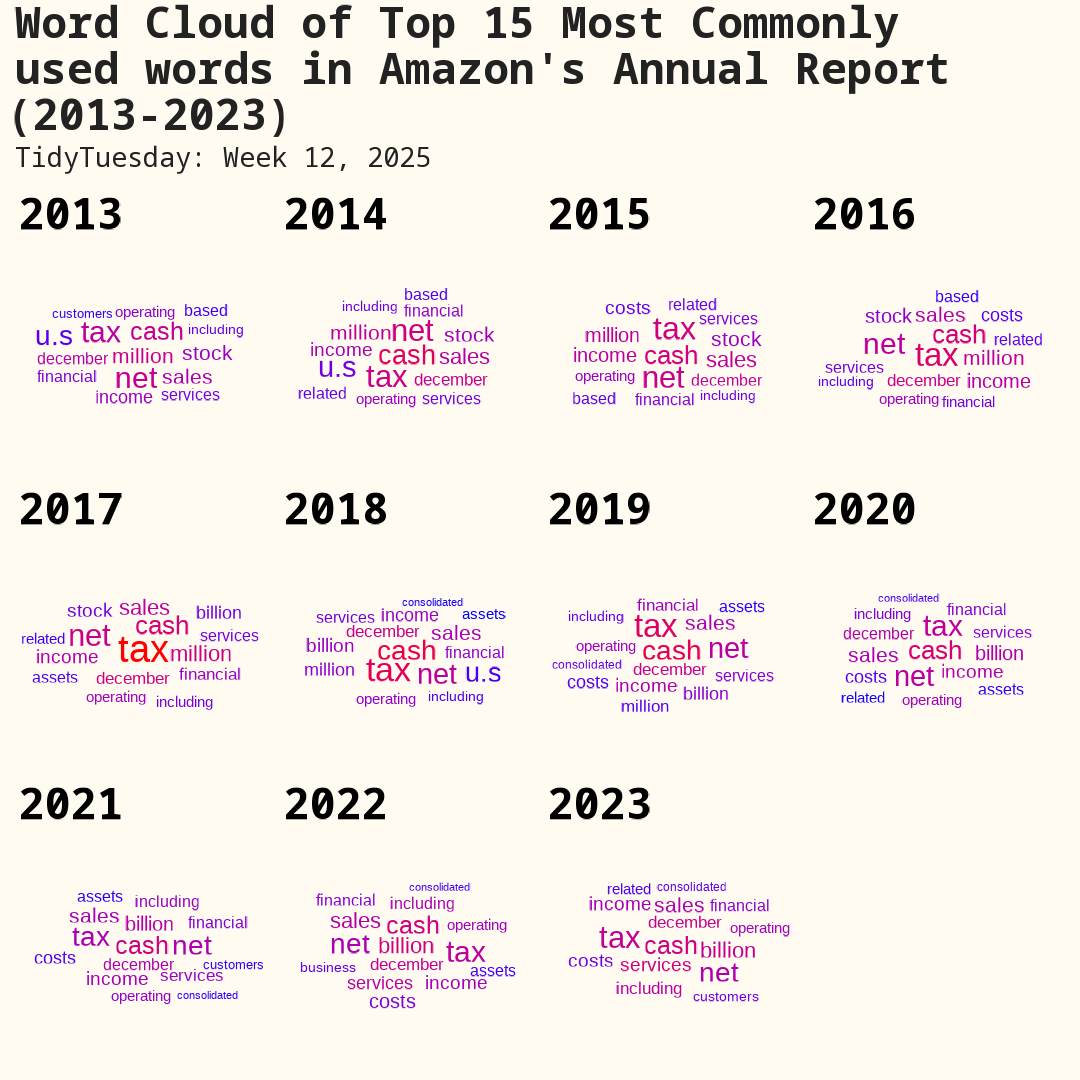
TidyTuesday Week 12: Amazon’s Annual Reports
28 Mar, 2025
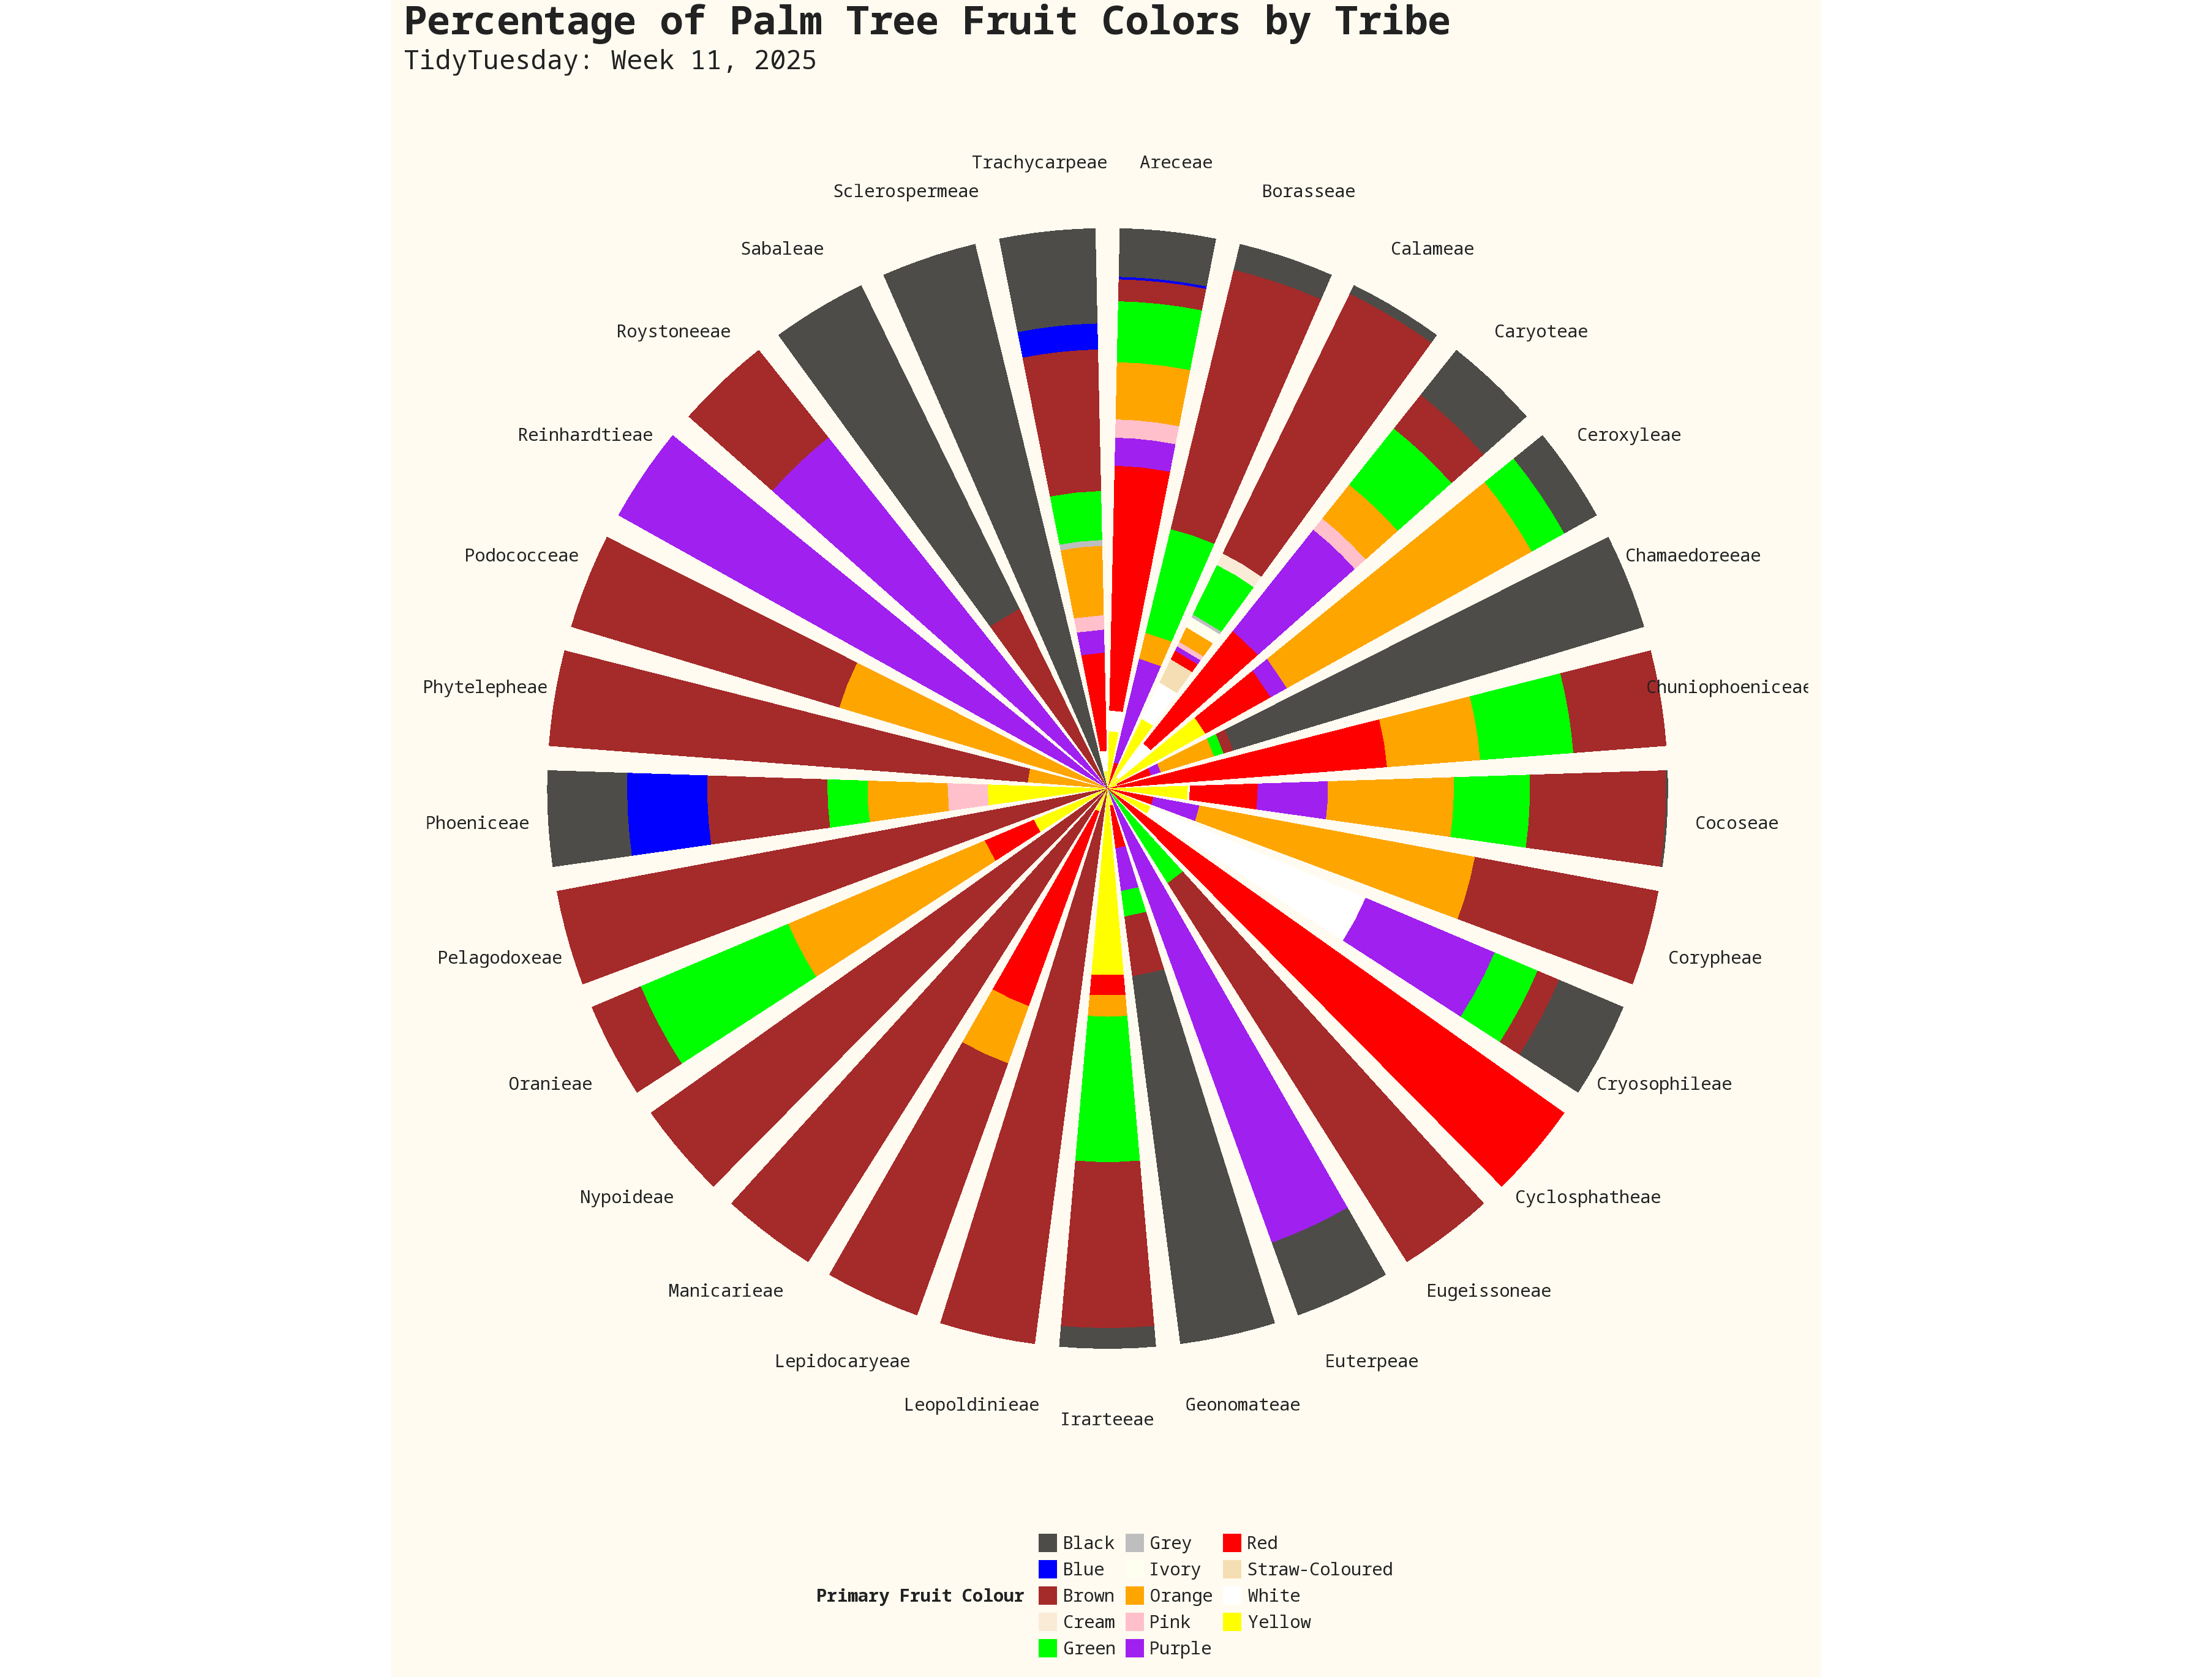
TidyTuesday Week 11: Palm Trees Analysis
19 Mar, 2025
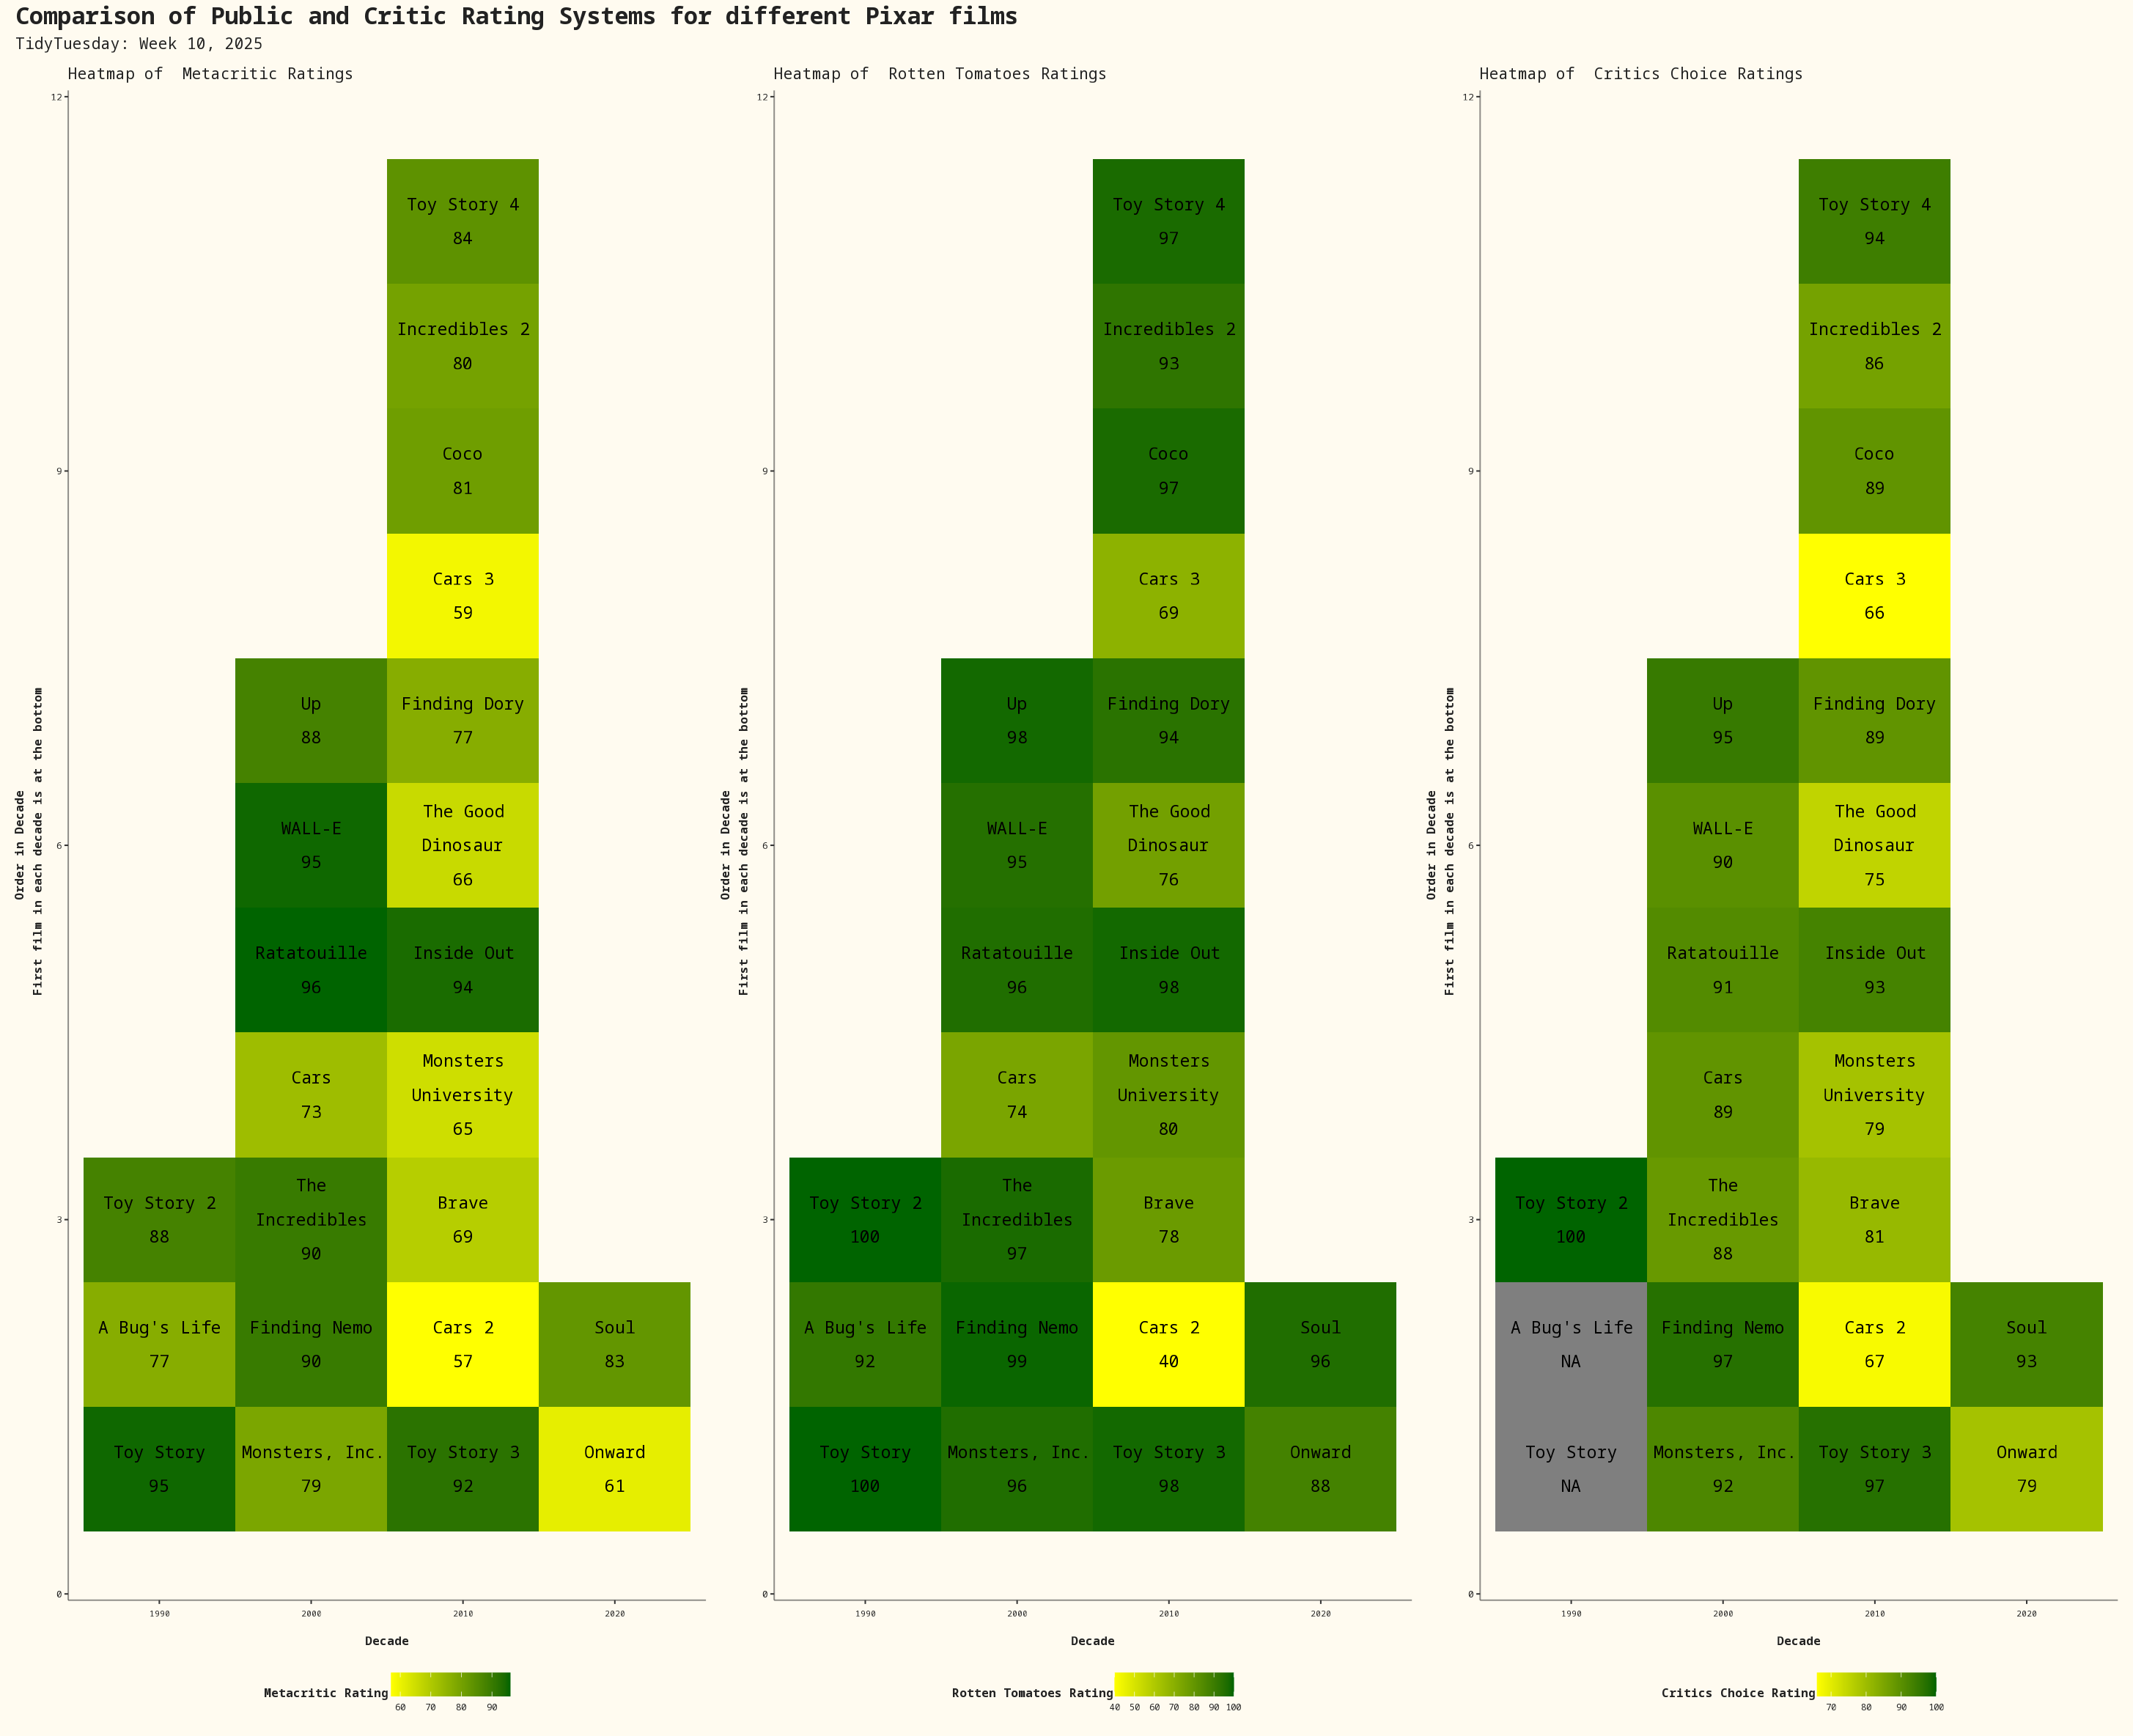
TidyTuesday Week 10: Pixar Films Analysis
17 Mar, 2025
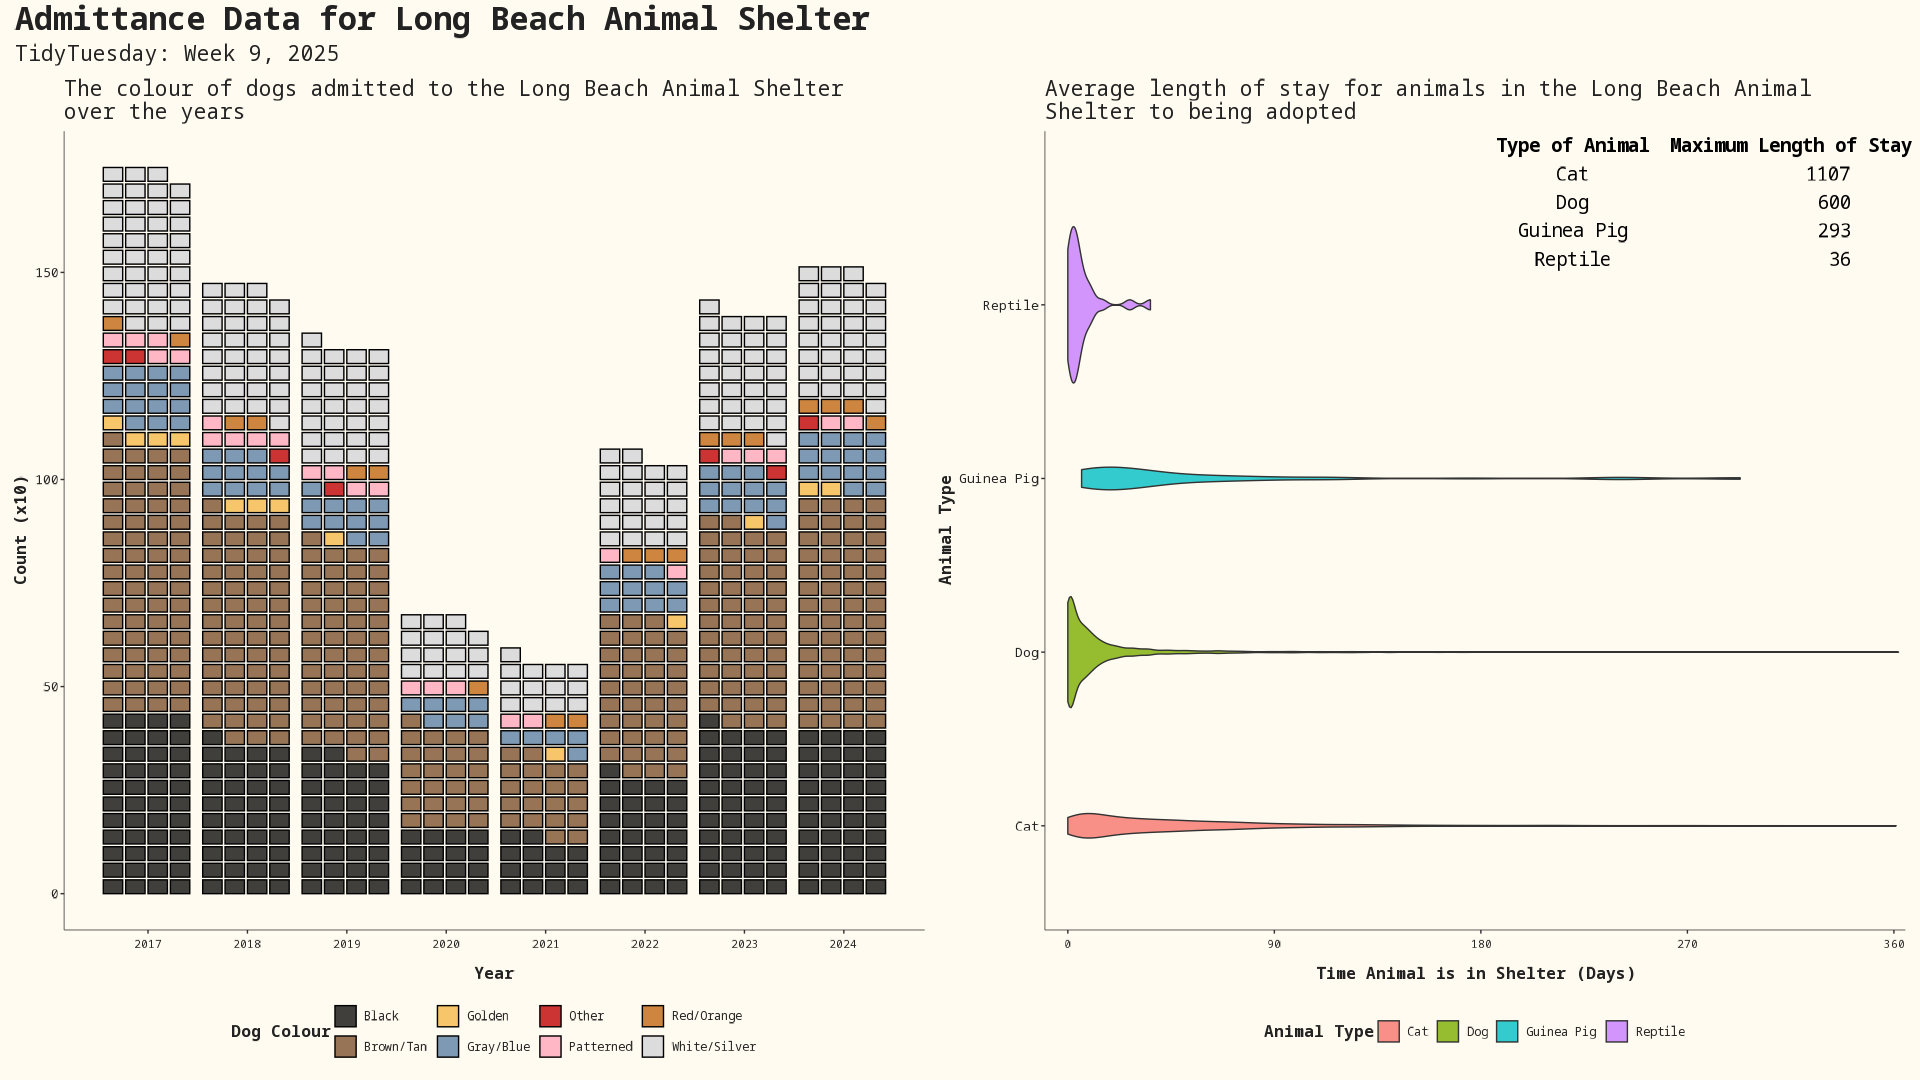
TidyTuesday Week 9: Long Beach Animal Shelter
4 Mar, 2025
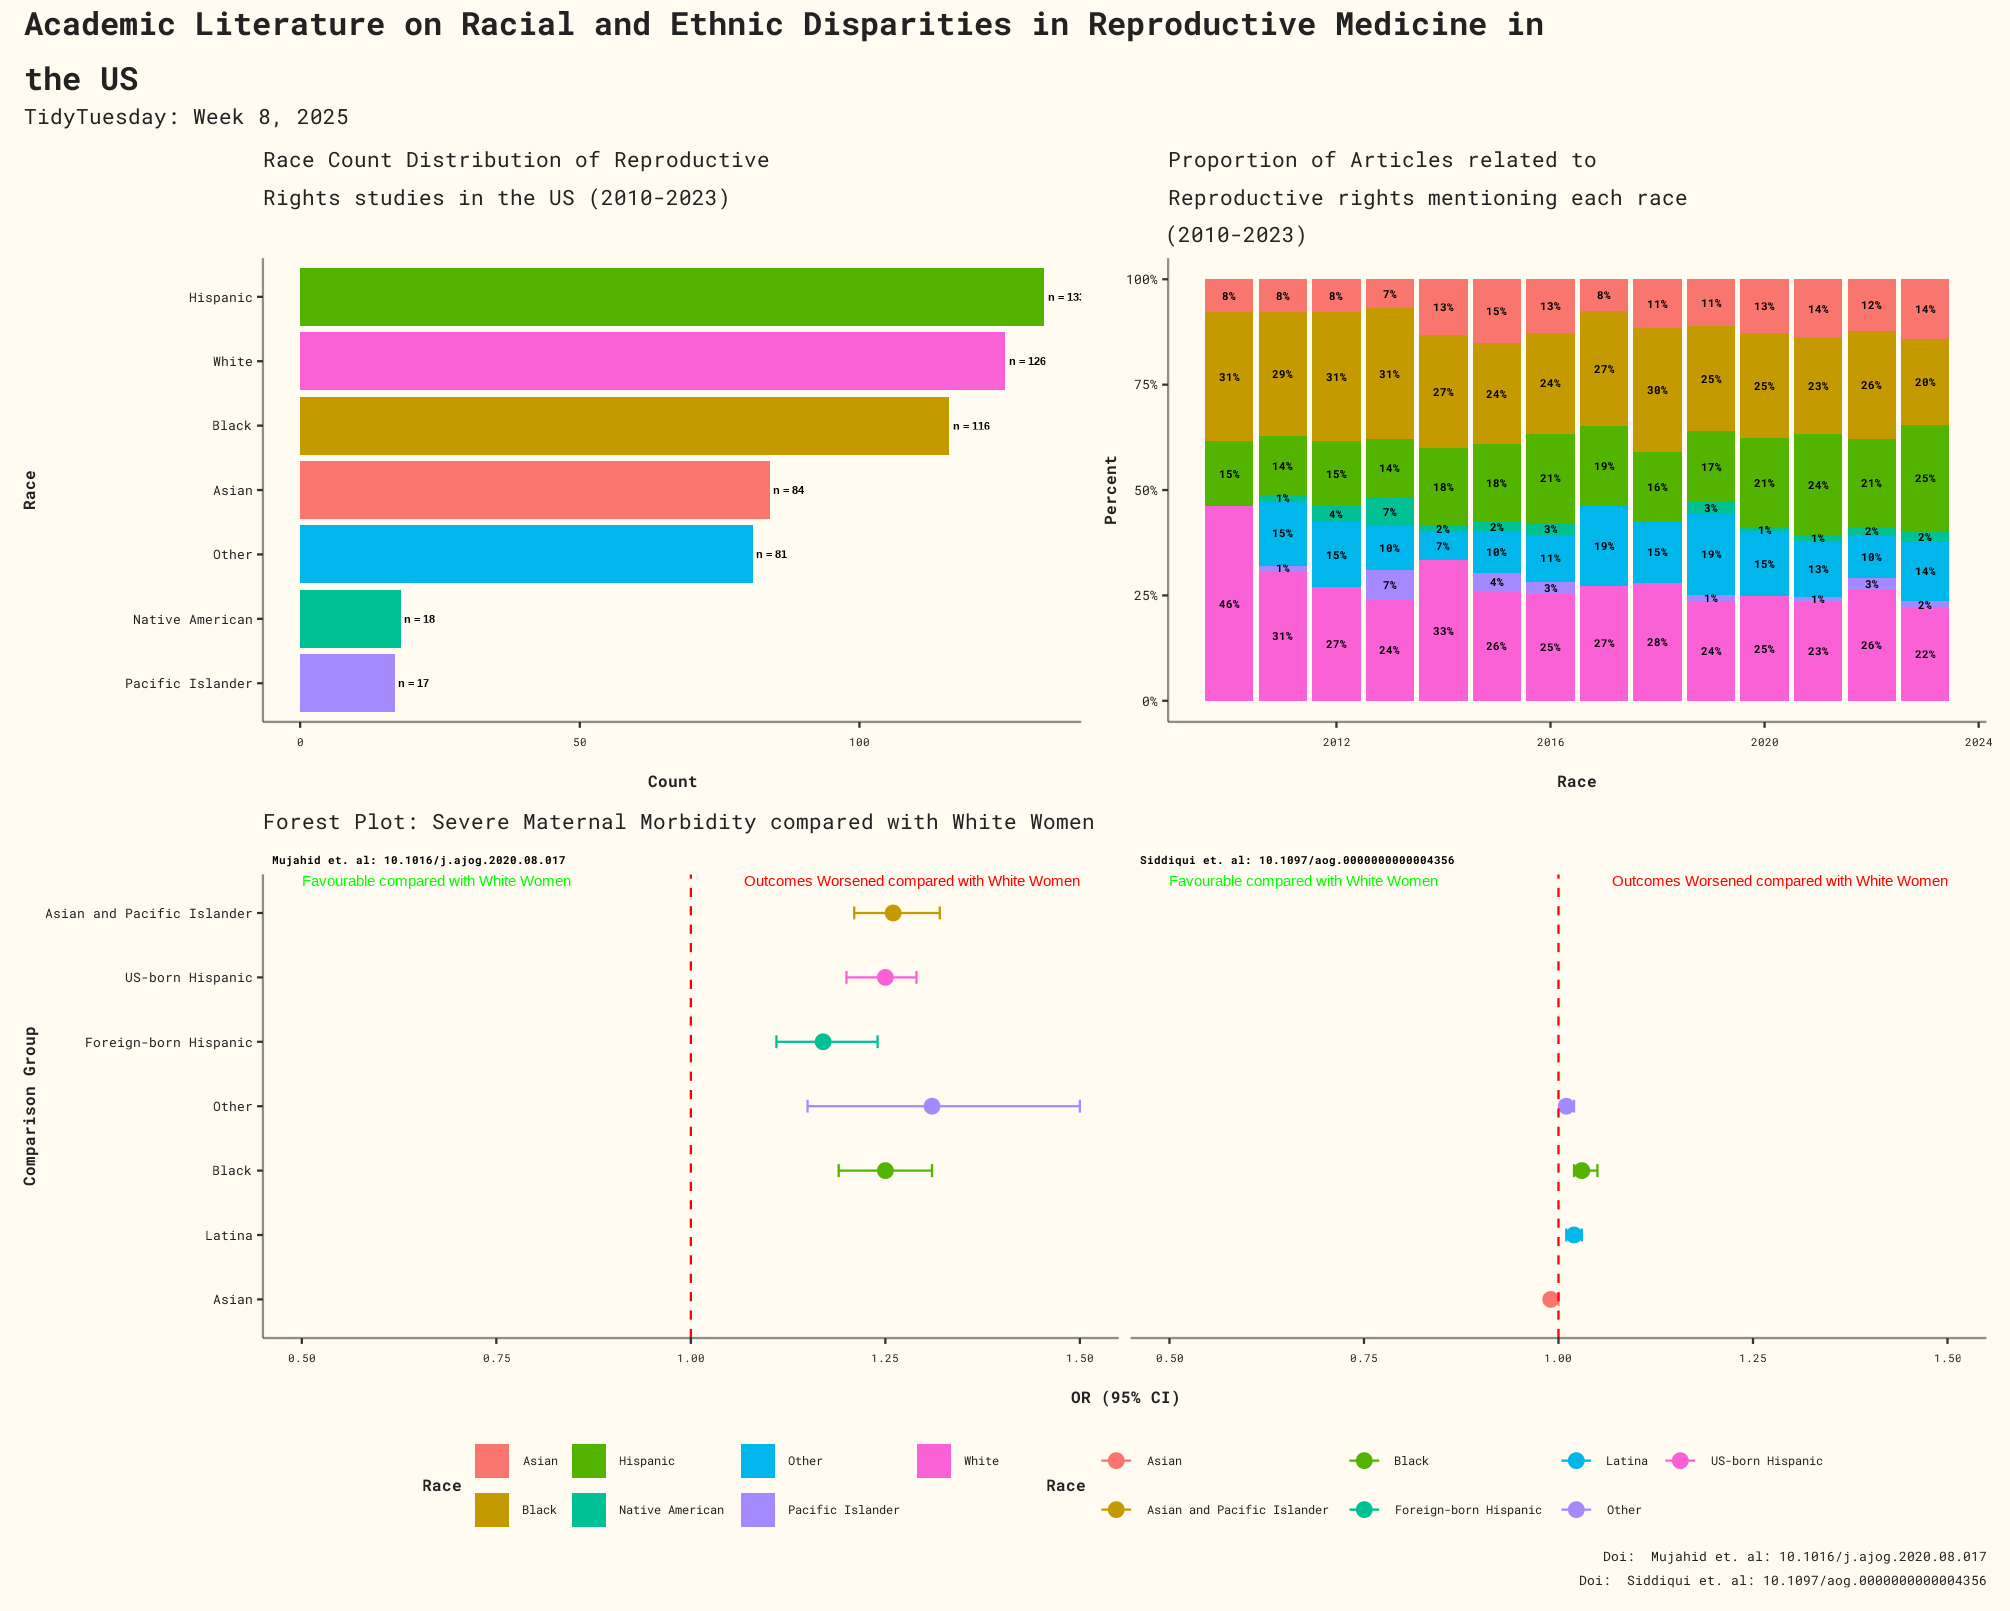
TidyTuesday Week 8: Racial Disparities in US Reproductive Medicine
25 Feb, 2025
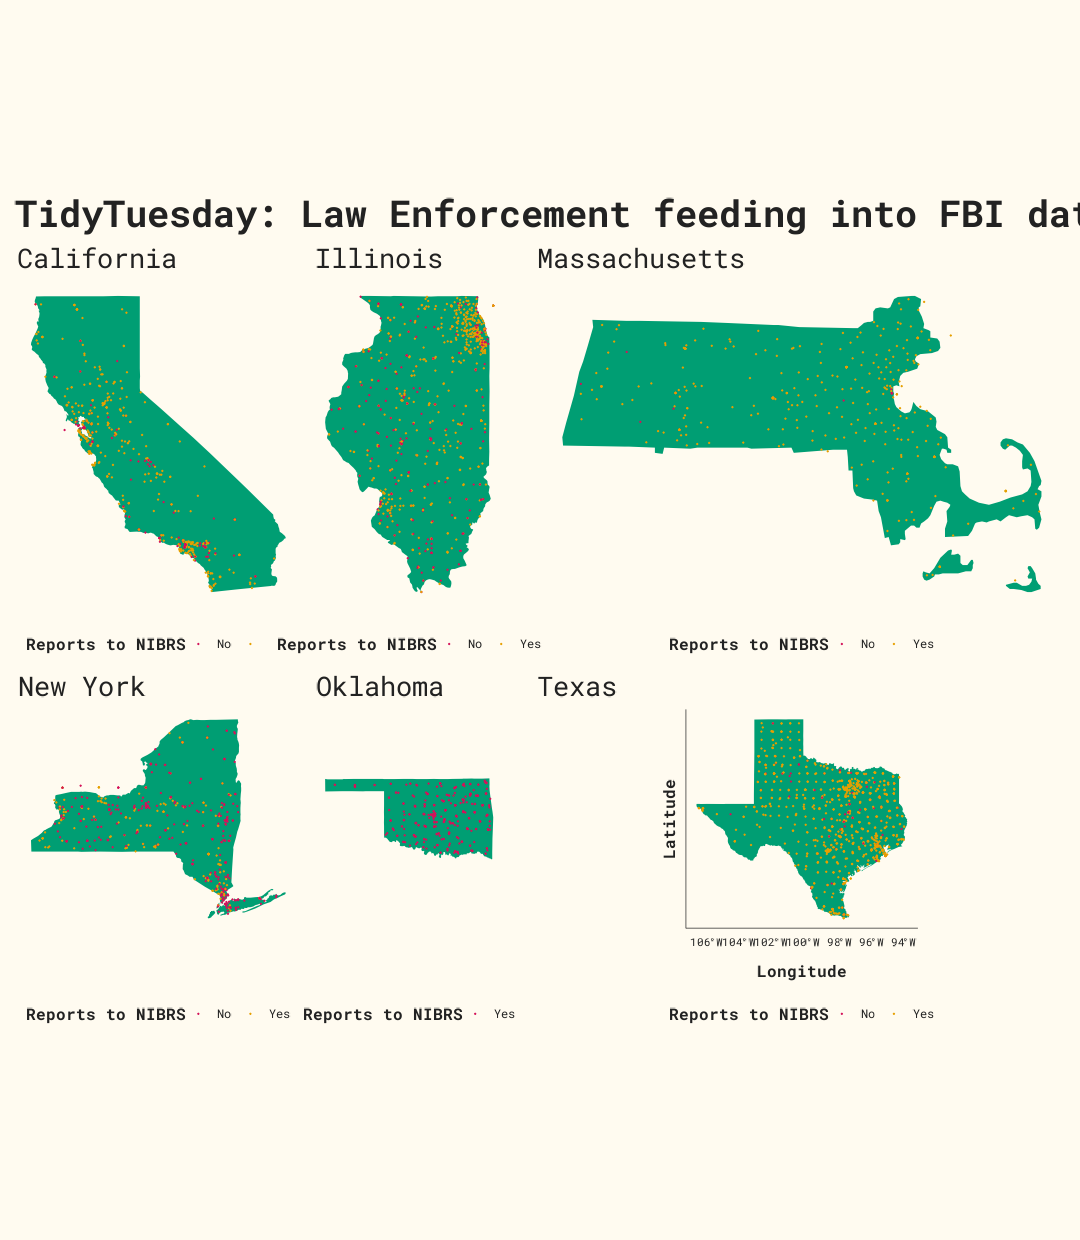
TidyTuesday Week 7: FBI Crime Reporting
19 Feb, 2025
Rugby Results Web App
17 Feb, 2025
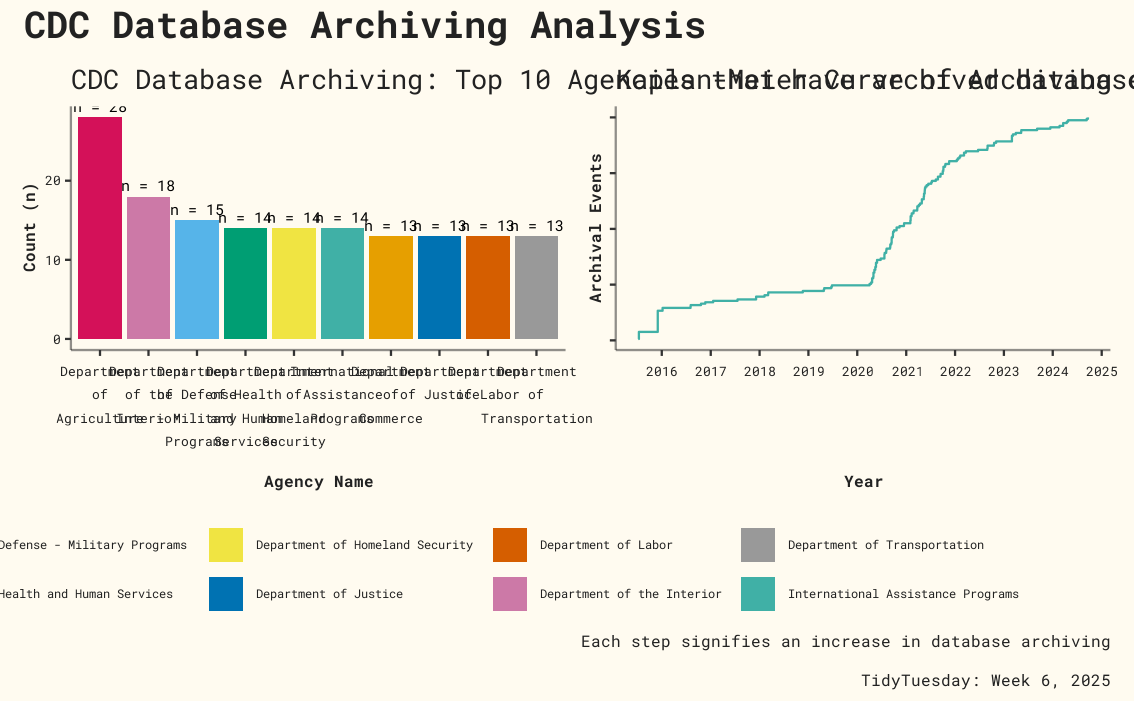
TidyTuesday Week 6: CDC Archive Data Analysis
11 Feb, 2025
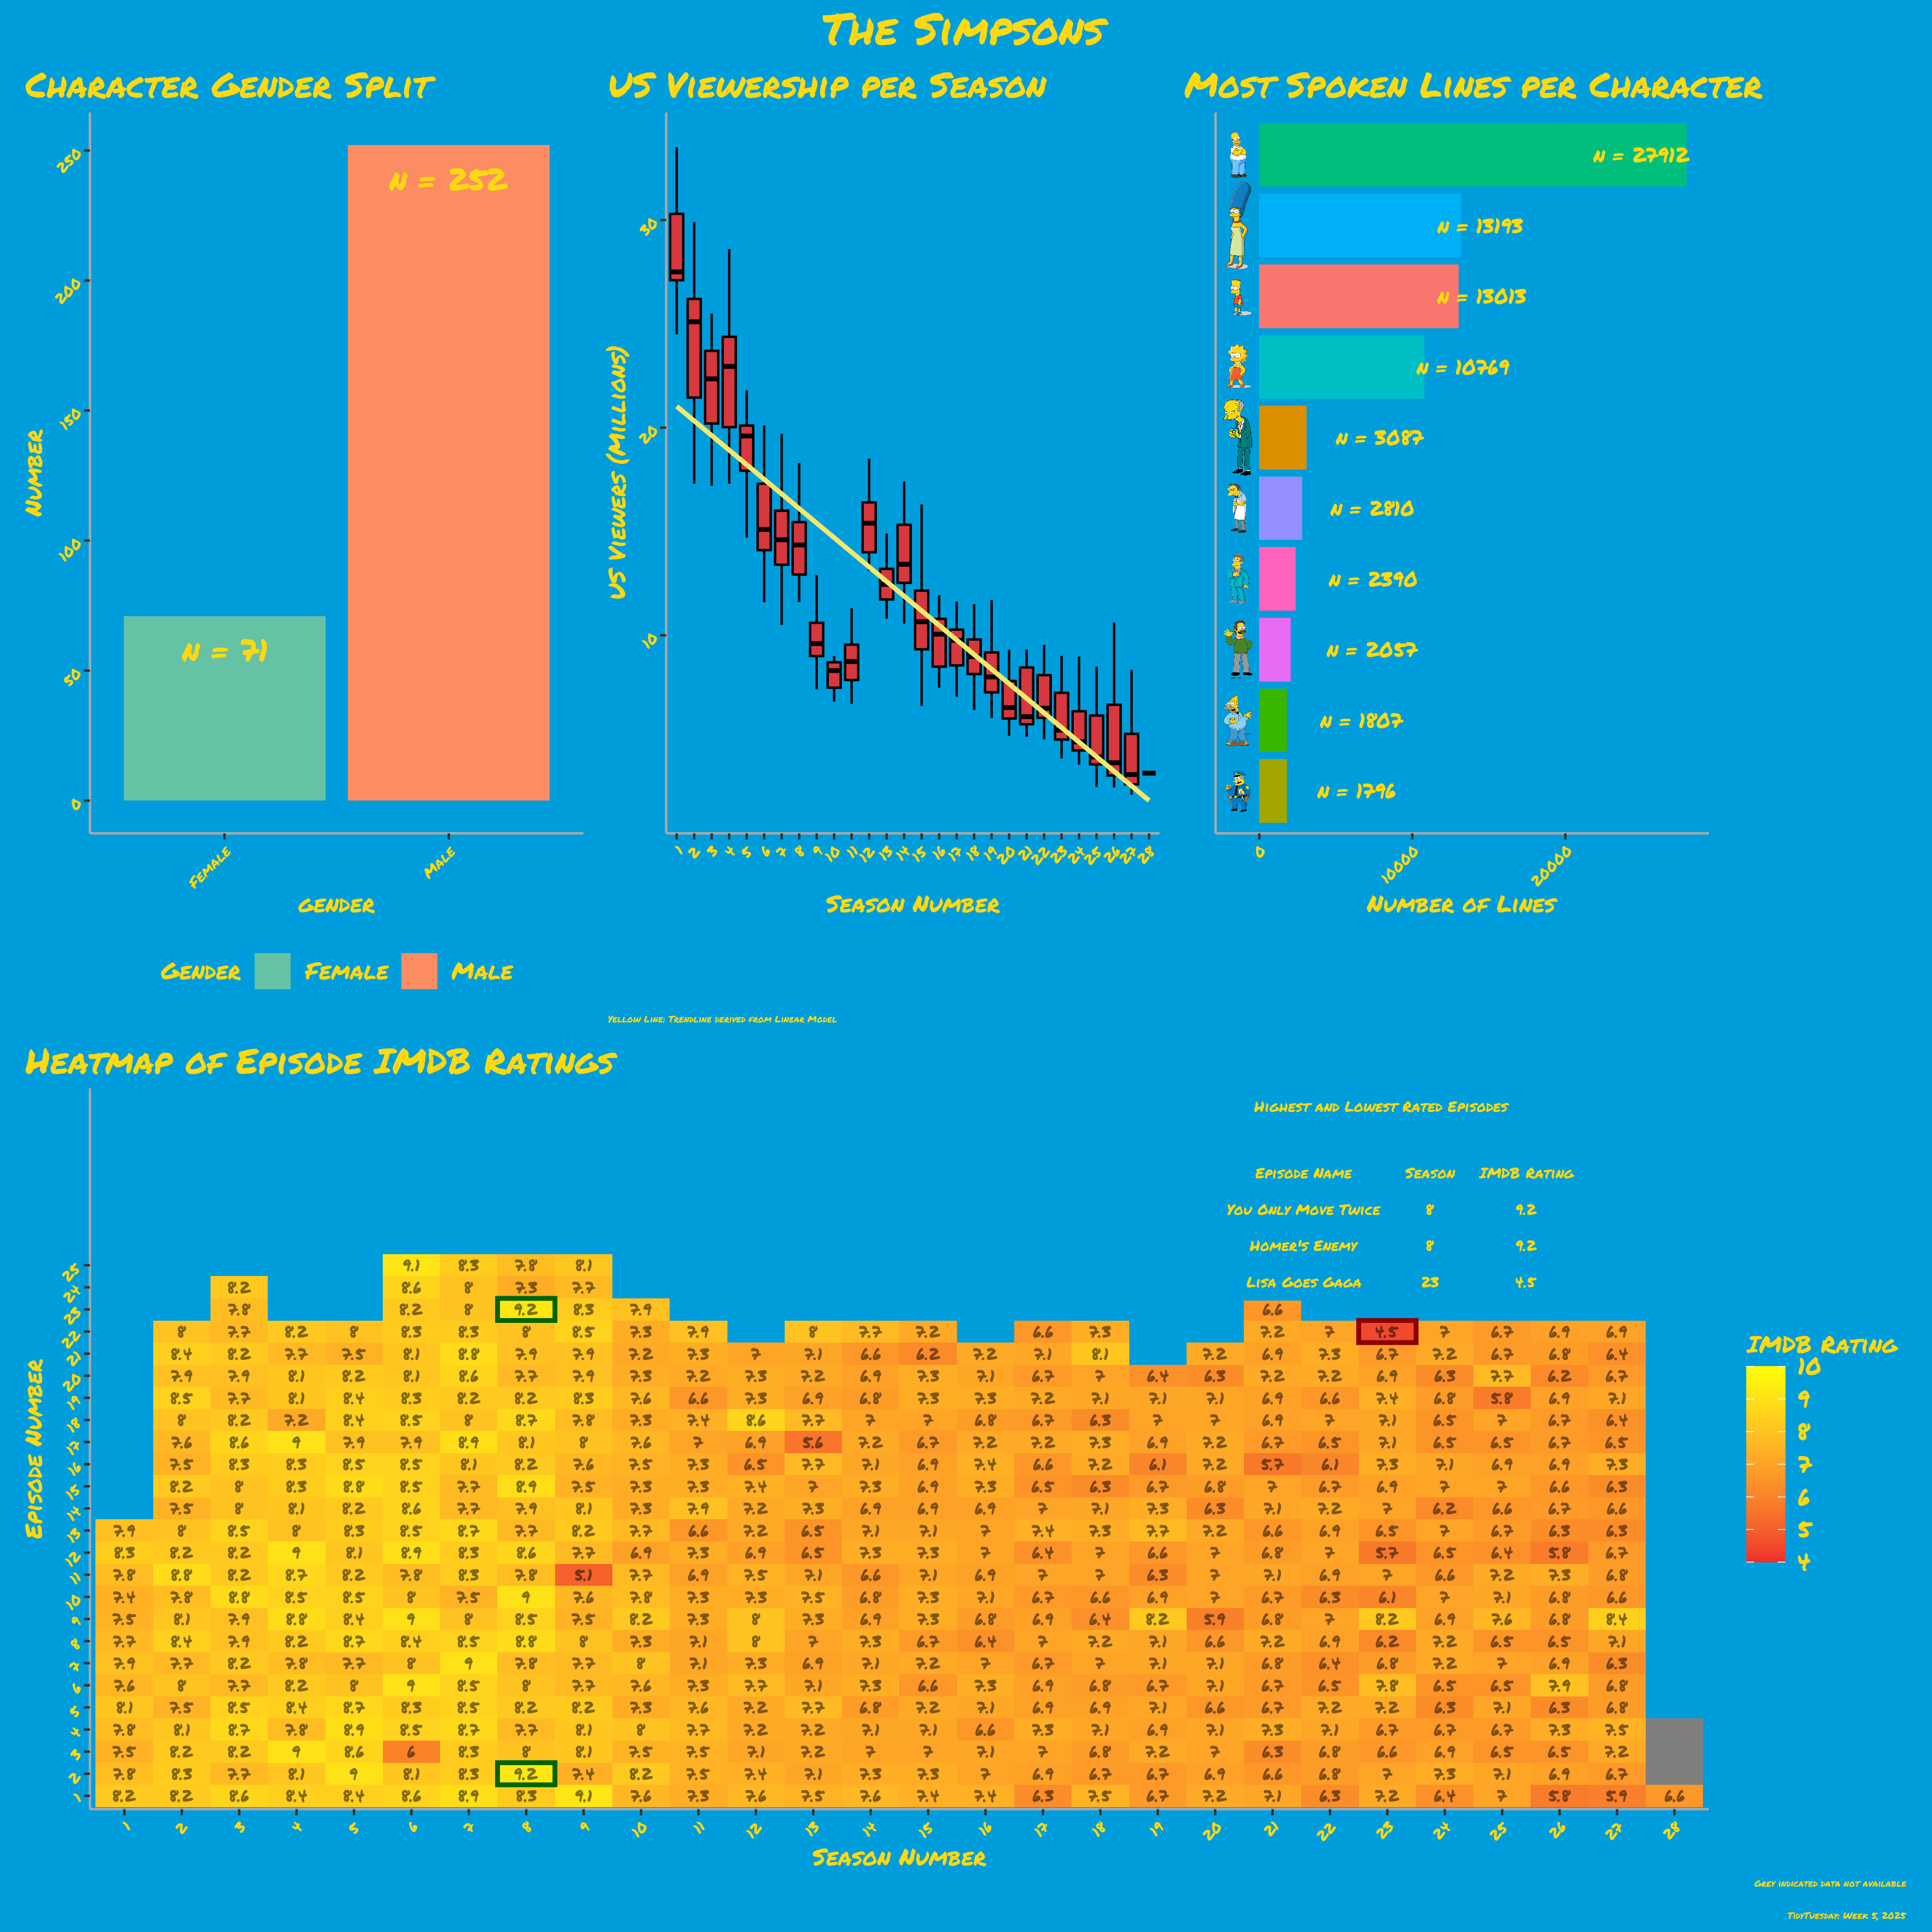
TidyTuesday Week 5: Simpsons Data Analysis
2 Feb, 2025
No matching items
Back to top