TidyTuesday (2026) Week 9: Golem Grad Tortoise Data
The datasets this week come from the paper ‘Sex Ratio Bias Triggers Demographic Suicide in a Dense Tortoise Population’. This topic seemed so interesting that even media like the New York Times picked it up: ‘Constant Sexual Aggression Drives Female Tortoises to Walk Off Cliffs’.
TidyTuesday
Data Visualization
Python Programming
2026
Author
Peter Gray
Published
February 24, 2026
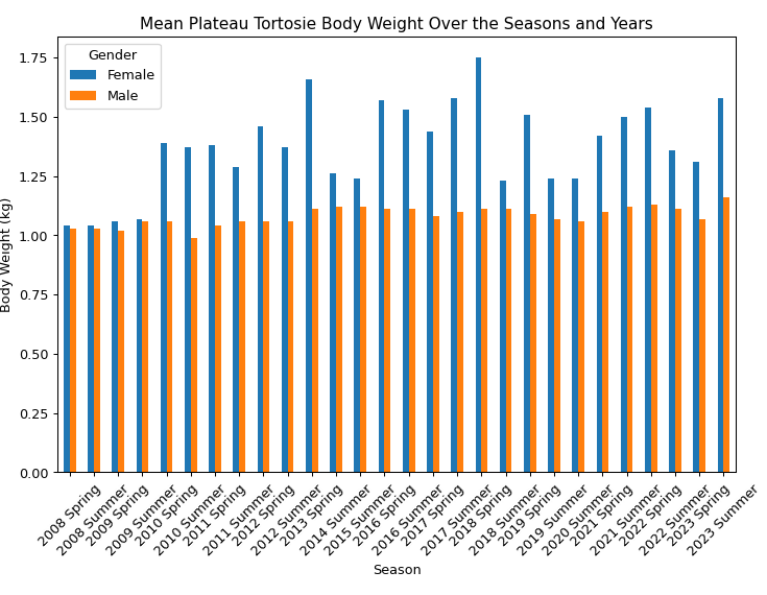
Weights of Tortoises per season per year
1. Python code
Show code
import pandas as pdimport numpy as npimport matplotlib.pyplot as pltclutch_size = pd.read_csv('https://raw.githubusercontent.com/rfordatascience/tidytuesday/main/data/2026/2026-03-03/clutch_size_cleaned.csv')tortoise_body = pd.read_csv('https://raw.githubusercontent.com/rfordatascience/tidytuesday/main/data/2026/2026-03-03/tortoise_body_condition_cleaned.csv')list(tortoise_body_condition_cleaned.columns.values)individual_avg = tortoise_body.groupby(['individual', 'sex', 'year', 'season'])['body_mass_grams'].mean().reset_index()mean_weight_season = individual_avg.groupby(['sex', 'year', 'season'])['body_mass_grams'].mean().round(2).reset_index()#mean_weight_season['body_mass_kilograms'] = (mean_weight_season['body_mass_grams'] /1000).round(2)mean_weight_season['year_season'] = mean_weight_season['year'].astype(str) +' '+ mean_weight_season['season']mean_weight_season['sex'] = np.where(mean_weight_season['sex'] =="f", "Female", "Male")season_order = {'spring': 1, 'summer': 2}mean_weight_season['season_order'] = mean_weight_season['season'].str.lower().map(season_order)mean_weight_season = mean_weight_season.sort_values(['year', 'season_order'])pivot_data = mean_weight_season.pivot( index='year_season', columns='sex', values='body_mass_kilograms')pivot_data.plot(kind='bar', figsize=(10, 6))plt.title('Mean Plateau Tortosie Body Weight Over the Seasons and Years')plt.xlabel('Season')plt.ylabel('Body Weight (kg)')plt.legend(title='Gender')plt.xticks(rotation=45)plt.tight_layout()plt.show()
 Weights of Tortoises per season per year